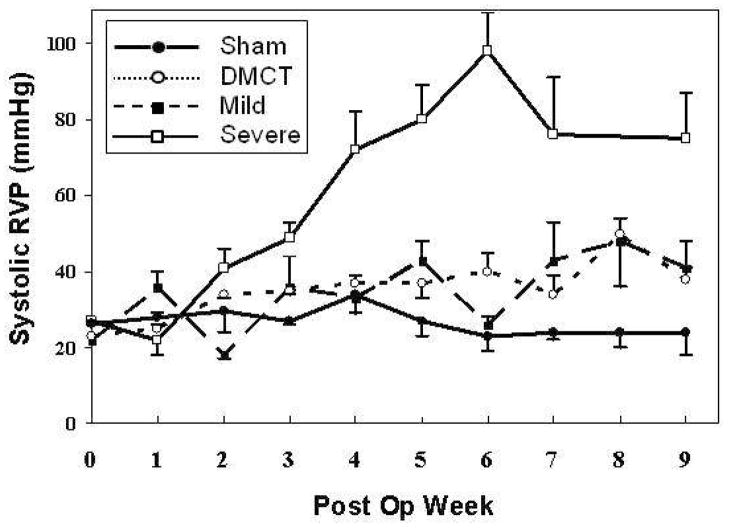
Figure 1.
Average weekly systolic right ventricular (RV) pressure measurements in the Sham (lower solid line, solid circle), dehydromonocrotaline (DMCT) (dotted line, open circle), mild pulmonary artery (PA) band (dashed line, solid square), and severe PA band (upper sold line, open square) groups. Error bars depict standard error of the mean at each time point.

