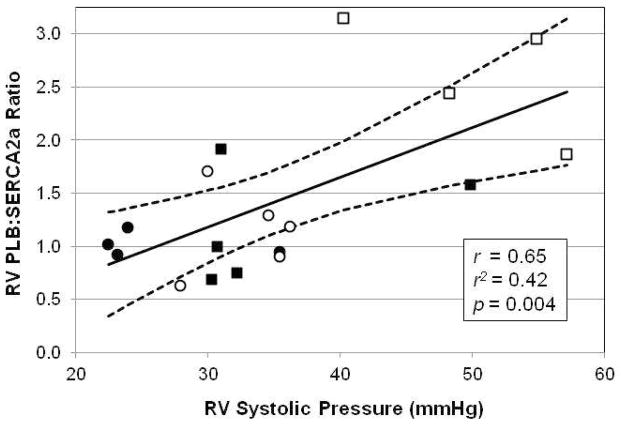
Figure 5.
Correlation of right ventricular (RV) PLB:SERCA2a protein ratio to systolic RV pressure measured in anesthetized, open-chest, closed-pericardium state. All 18 animals were included in this analysis, including sham (solid circles), dehydromonocrotaline (DMCT, open circles), mild pulmonary artery (PA) banding (solid squares), and severe PA banding (open squares). The solid line represents the predicted values from the linear regression PLB:SERCA2a = −0.22 + (0.47 × RVP), and the dashed lines represent 95% confidence intervals.

