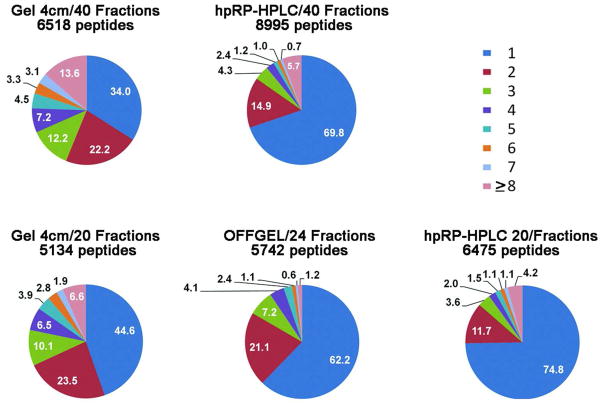
Figure 8. Separation efficiencies for the three fractionation methods.
The pie charts show percentages of peptides identified in one or more fractions in the different proteomes. The number of peptides tabulated here is somewhat larger than the number of unique peptides shown in earlier figures, because peptides containing one or more asparagines and the same peptide sequence with one or more deamidated asparagines were treated as different peptides for the purpose of assessing separation efficiency.

