
Figure 1. Daytime variations in tear osmolarity.
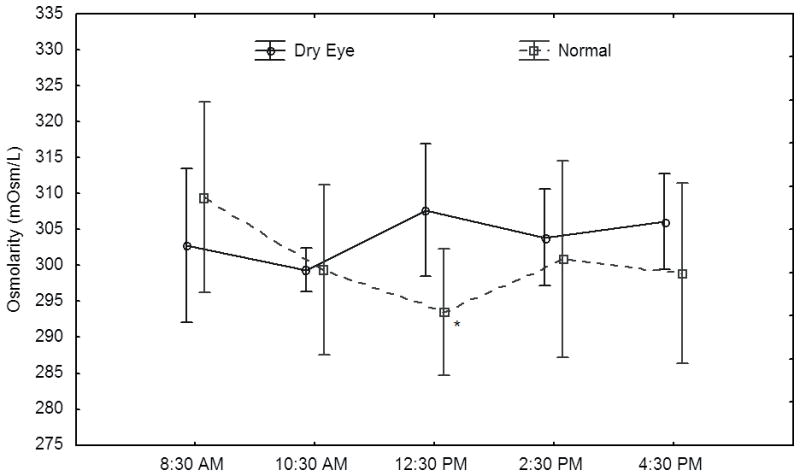
For normal subjects, tear osmolarity had fallen to levels that were significantly lower than baseline levels by 12:30 PM. Contrarily, there were no differences in the tear osmolarity values of the dry eye group at any of the 5 time points (P > 0.05). * indicates P < 0.05 compared with the baseline osmolarity value. Bars indicate 95% confidence intervals.