
Figure 2. Variations in tear osmolarity.
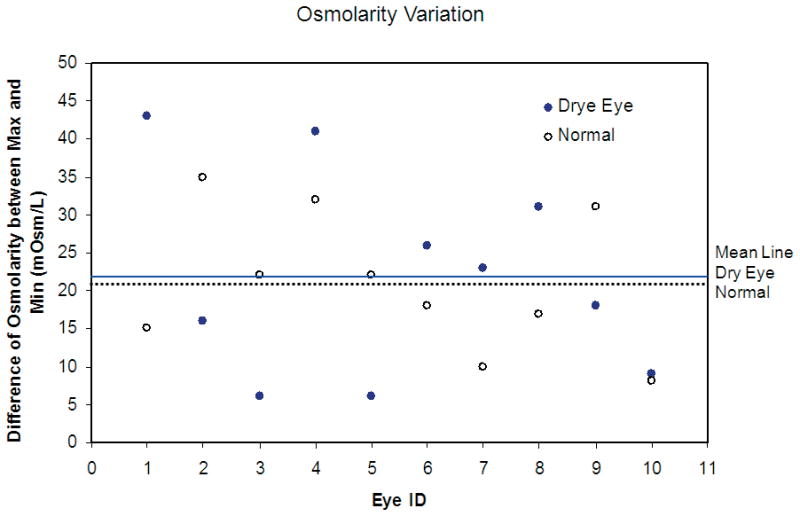
In both the dry eye and normal groups, the differences between the minimum and the maximum tear osmolarities that were measured for each subject during the course of the 8-hour study period fell within a wide range of values. The solid line indicates the average of the maximum differences in the tear osmolarity values of the members of the dry eye group; the dashed line indicates the average of the maximum differences in the osmolarity values of the members of the normal group.