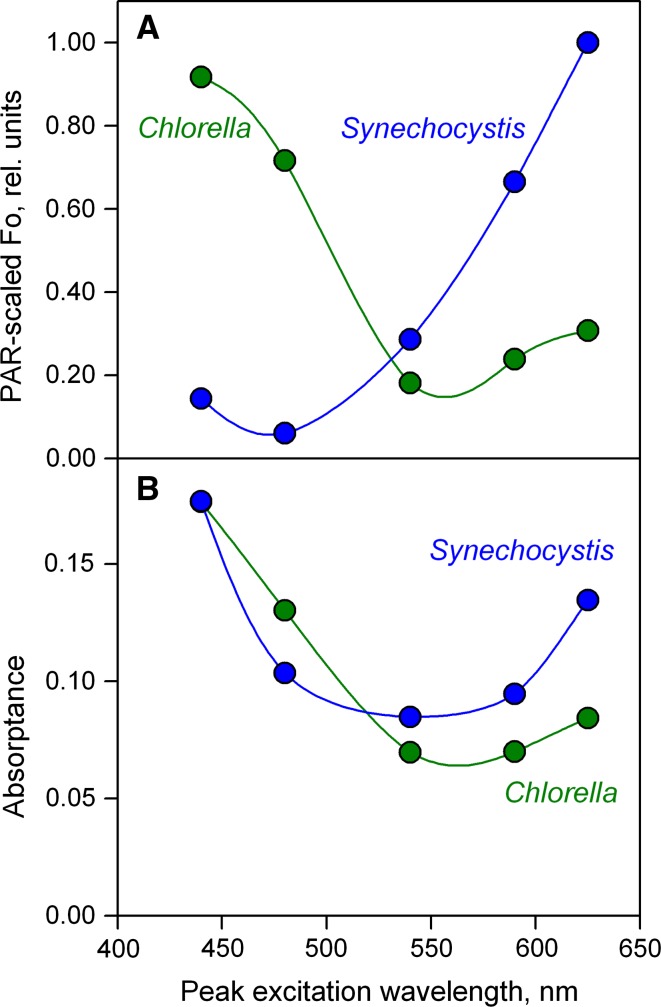
Fig. 3.
Comparison of PAR-scaled F o and absorptance in dilute suspensions of Chlorella and Synechocystis as a function of the color of the pulse-modulated ML. Cell densities of the two suspensions were adjusted to give the same absorptance at 440 nm. A Normalized F o/PAR versus peak wavelength of the ML. The data were normalized to unity at maximal relative F o/PAR, i.e., for 625 nm with Synechocystis. B Absorptance in the same suspensions plotted vs peak wavelength of the ML

