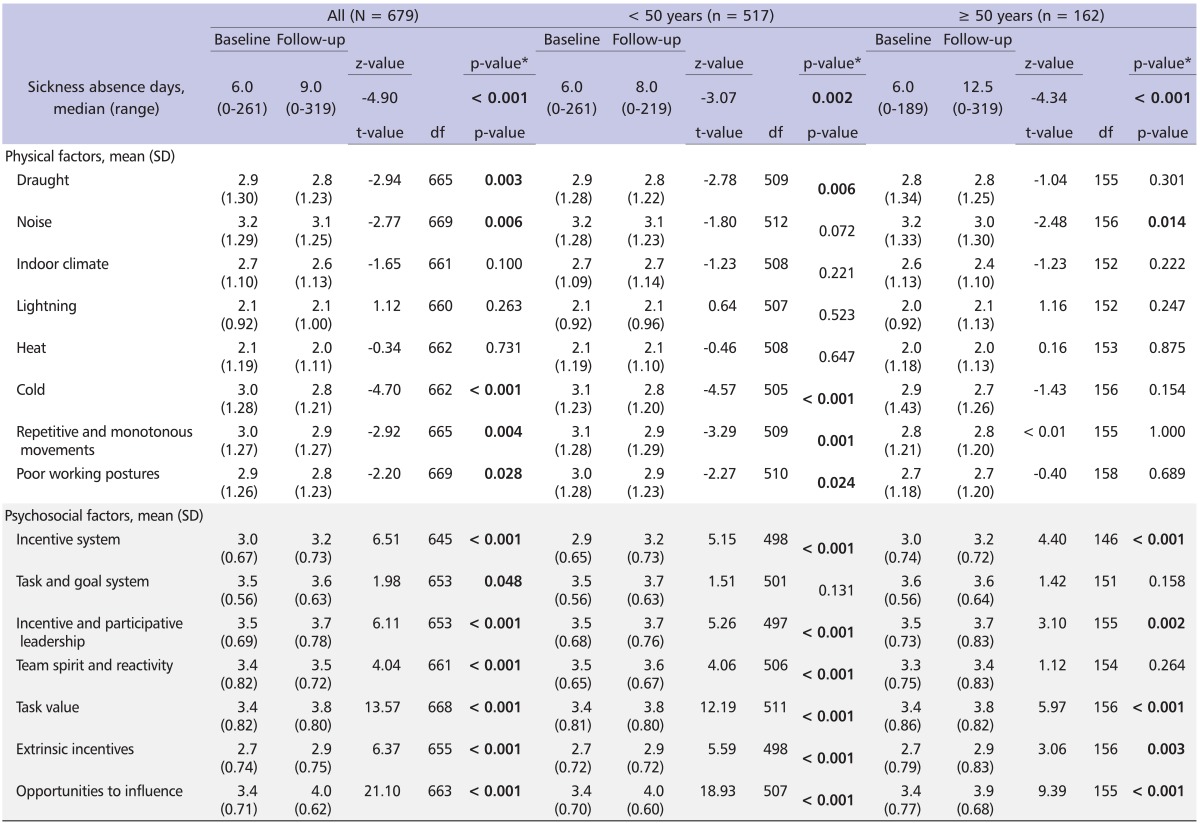
Table 1.
Distributions of sickness absence days, perceived physical and psychosocial factors in the baseline year and in the follow-up year and their statistical differences among all study subjects and among two age groups
SD: standard deviation. *analyzed by paired samples t-test and results shown by t-value with degrees of freedom (df) despite of sickness absence days, which were analyzed by Wilcoxon Rank Sum test. Statistically significant results were shown in bold.

