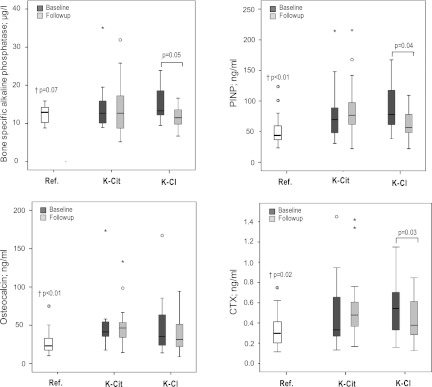
Figure 6.
Serologic biomarkers of bone metabolism. Results are given as absolute values in boxplots, representing the median, 25th and 75th percentiles, and 2 SDs. †Denotes the P value for significance between the reference population of healthy individuals and the combined renal transplant patients. Ref., reference; K-Cit, potassium citrate; K-Cl, potassium chloride; PINP, N-terminal propeptide of precollagen I; CTX, C-terminal telopeptide/CrossLaps.

