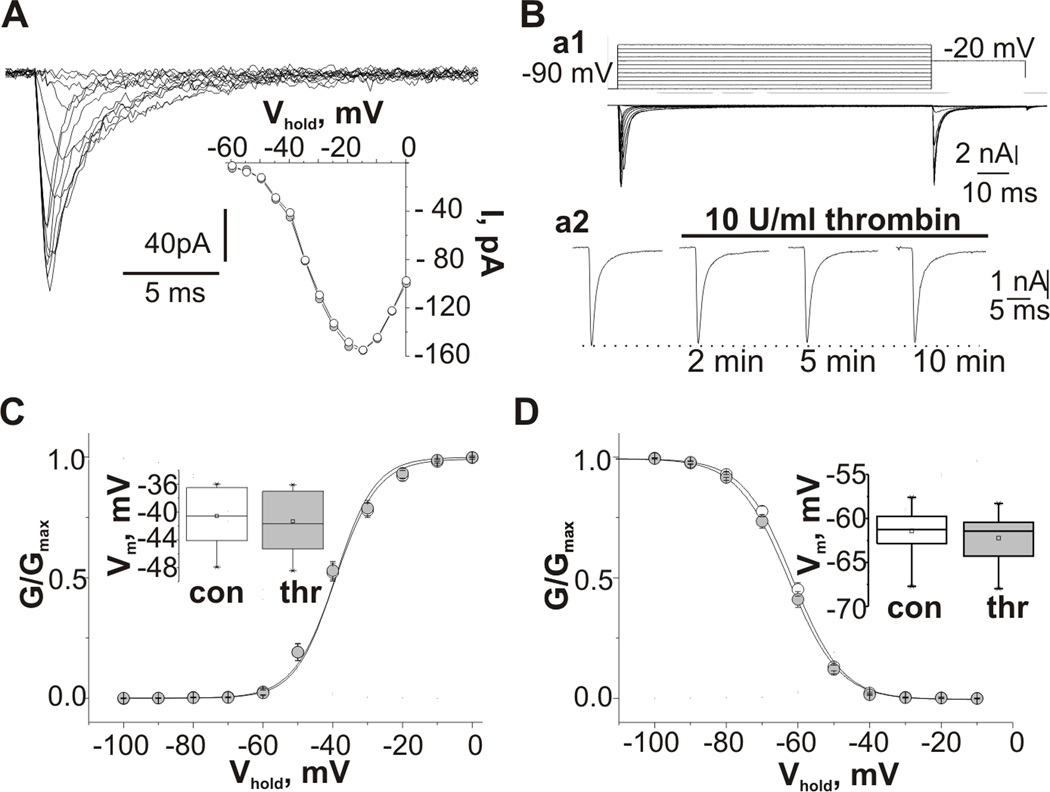
Figure 2.
Effect of thrombin on transient voltage-gated sodium currents. (A) Traces of INat recorded from a CA3 pyramidal cell outside out patch at different test pulse potentials. Insert shows current-voltage relationship of INat recorded from the same patch in control conditions (white) and in 10 min of the thrombin presence (grey); (B) Examples of whole-cell voltage-clamp recordings from CA3 pyramidal cell of P7 hippocampal slice. Ba1 upper panel pulse protocol: holding potential, −90 mV; 100 ms test pulse to membrane potentials between −90 and +20mV (10 mV increments); 30ms step to −20mV; and step back to holding potential. Lower panel traces of INat recorded using this protocol. Ba2 time course of effect of application of 10 U/ml thrombin on the maximal peak amplitude of INat. Recordings were made at depolarizing pulse to −20 mV. (C,D) Summarized voltage dependences of the normalized conductance (C) and steady-state inactivation (D) of INat recorded from CA3 pyramidal neurons in whole-cell configuration from control cells (white) and in the presence of thrombin (grey) fitted by a Boltzmann function. Inserts represent summarized box plots of mid-point potentials of the steady-state activation (C) and inactivation curves (D). Values are Mean±SE.

