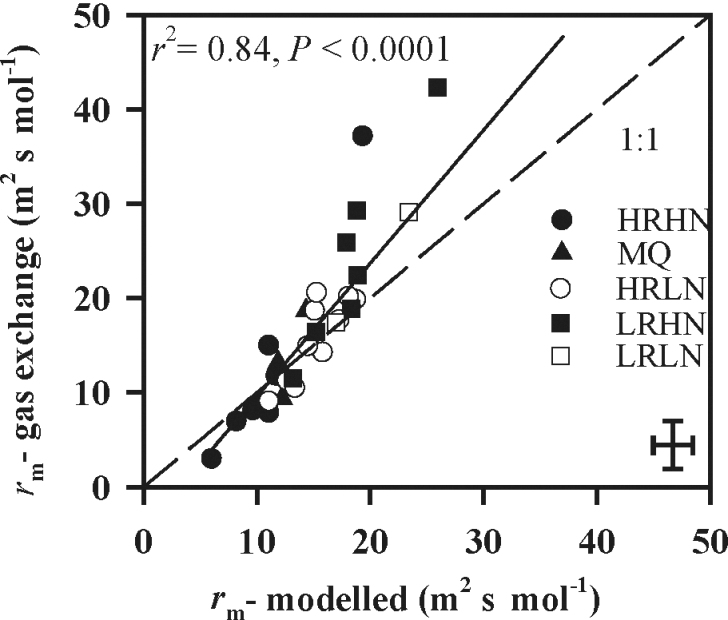
Fig. 1.
Correlation between mesophyll diffusion resistance determined from combined gas-exchange and chlorophyll fluorescence measurements (equation 1, r m, gas exchange) and mesophyll resistance calculated from anatomical data (equations 6–9, r m, modelled). Data were fitted by linear regression. The error bars in the lower right corner indicate the maximum size of standard errors across species. HRHN, higher rain, high nutrients; MQ, Macquarie University campus; HRLN, higher rain, low nutrients; LRHN, lower rain, high nutrients; LRLN, lower rain, low nutrients. See Table 2 for studied species and site information.

