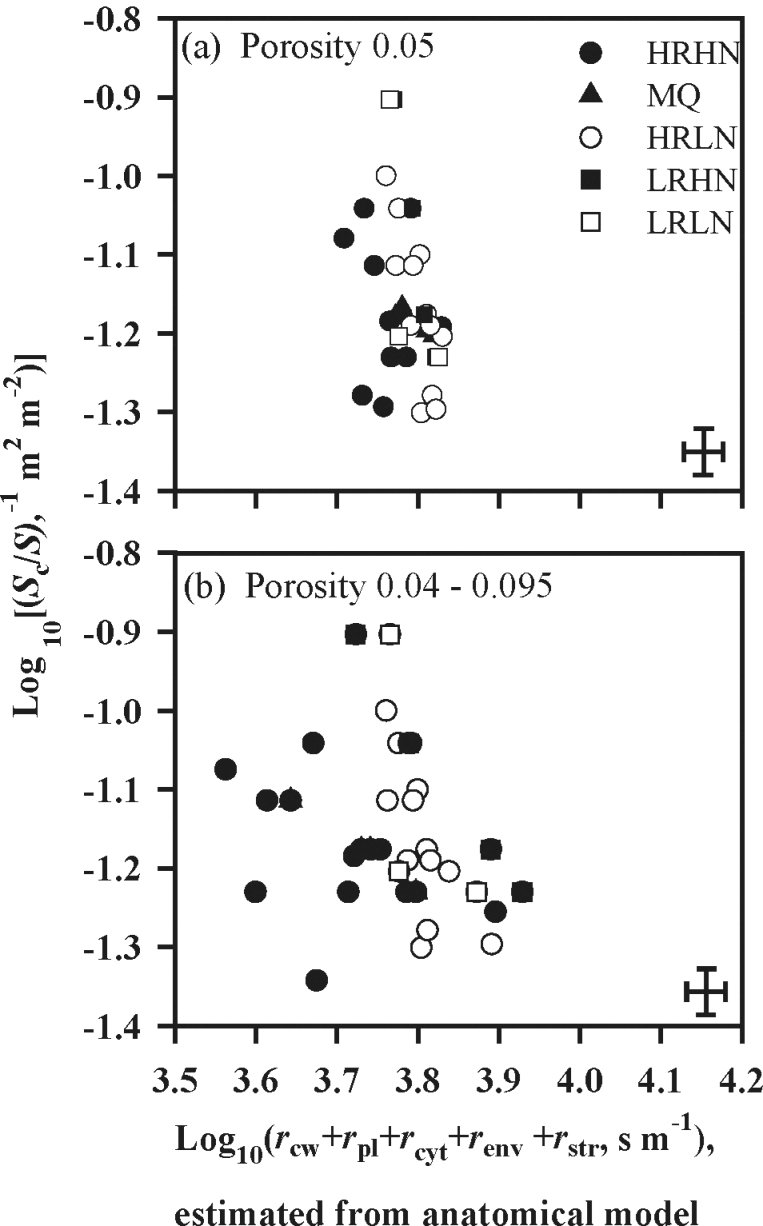
Fig. 3.
Relationship between the inverse of chloroplastsurface area exposed to intercellular airspace per unit leaf area (S c/S)–1, and the sum of individual cellular resistances [(r cw+r pl+r cyt+r env+r str)]. Both axes are log-transformed. Log (liquid-phase resistance) is the sum of these two log-components, Log[(S c/S)–1] and Log(r cw+r pl+r cyt+r env+r str) and increasestowards the upper right corner. The sum of serial liquid-phase resistances was calculated assuming a constant mesophyllcell wall porosity of 0.05 for all species (a), or assumingvariable porosity of mesophyll cell walls, with porosity rangingfrom 0.040 to 0.095, decreasing with increasing depth of cellwall (b). A constant value of 0.0035 m s–1 was assigned toboth r pl and r env. Symbols and error bars as in Fig. 1.

