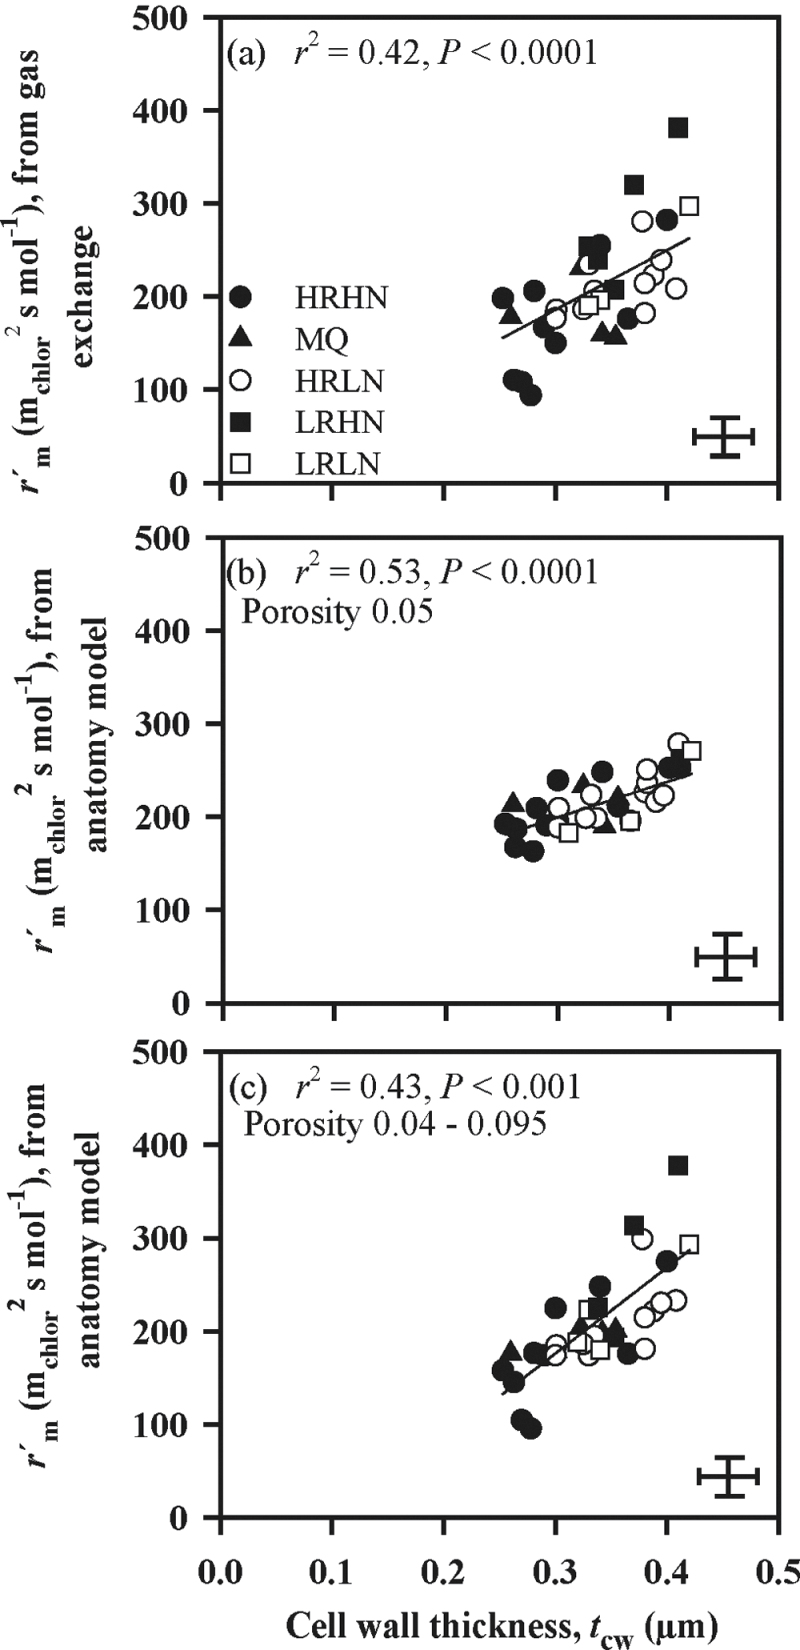
Fig. 4.
Correlations between mesophyll resistance per unit exposed chloroplast surface area,  and cell wall thickness (t
cw) for
  estimates derived from gas-exchange measurements (a) and modelled using anatomical data, either assuming a constant mesophyll cell wall porosity of 0.05 for all species (b) or varying the porosity (p
i) between 0.040 to 0.095 across species (c). In the latter case, the best fit was obtained by varying p
i linearly from 0.095 at the lowest cell wall thickness of 0.252 µm to 0.040 at the maximum cell wall thickness of 0.420 µm. Representation of symbols and error bars as in Fig. 1.

