
Figure 4.
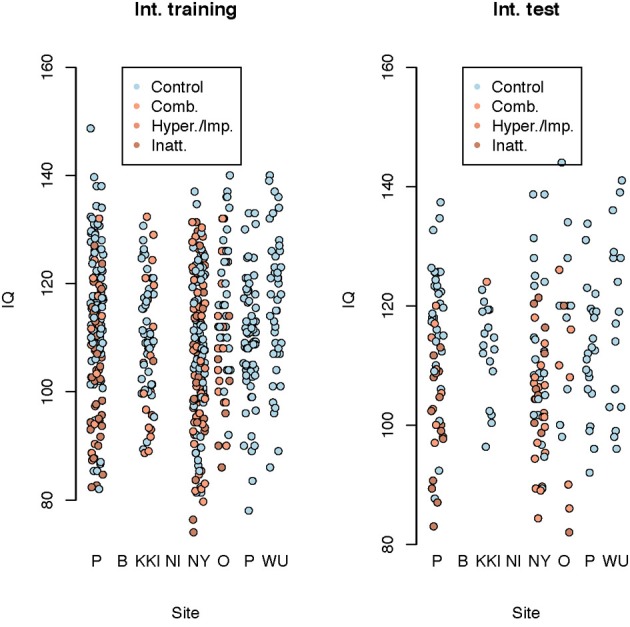
Dot plot of composite intelligence quotients (average of all available IQ measurements per subject) by data contributing site color coded by disease subtype for the internal training set and internal test set.
Official websites use .gov
A
.gov website belongs to an official
government organization in the United States.
Secure .gov websites use HTTPS
A lock (
) or https:// means you've safely
connected to the .gov website. Share sensitive
information only on official, secure websites.
Dot plot of composite intelligence quotients (average of all available IQ measurements per subject) by data contributing site color coded by disease subtype for the internal training set and internal test set.