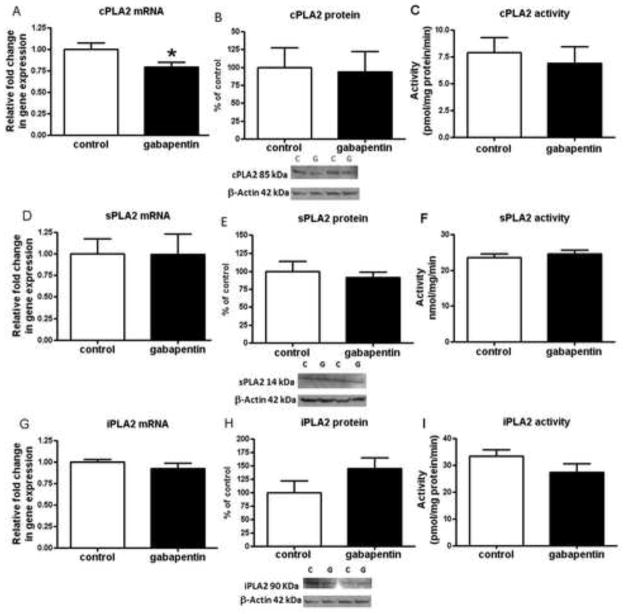
Fig. 1.
PLA2 mRNA, protein and activity levels in brains of gabapentin treated and control rats. Mean mRNA for cPLA2 (p = 0.02) (a); sPLA2 (p = 0.98) (d); and iPLA2 (p = 0.33) (g) in control (open bars) and gabapentin (filled bars) treated rat brain (n = 6 in control and gabapentin groups), measured using RT-PCR. mRNA levels in brain are normalized to the endogenous control (β2 microglobulin) and relative to control level (calibrator), using the ΔΔCT method. Mean brain protein levels with representative immunoblots for cPLA2 IVA (n = 8 per group; p = 0.88) (b); sPLA2 IIA (n = 8 per group; p = 0.60) (e); and iPLA2 VIA (h) (n = 7 per group, gabapentin due to one outlier in each group that was removed; p = 0.15) from control and gabapentin treated rats. Data are ratios of optical densities of cPLA2, sPLA2, or iPLA2 expressed as percentage of control. Mean activity of cPLA2 (n = 8, control and n = 7, gabapentin, one sample omitted due to activity level below blank; p = 0.38) (c); sPLA2 (n = 8 per group; p = 0.49) (f); and iPLA2 (n = 8 per group; p = 0.14) (i) in control and gabapentin treated rat brain. Values are mean ± SEM, *p< 0.05

