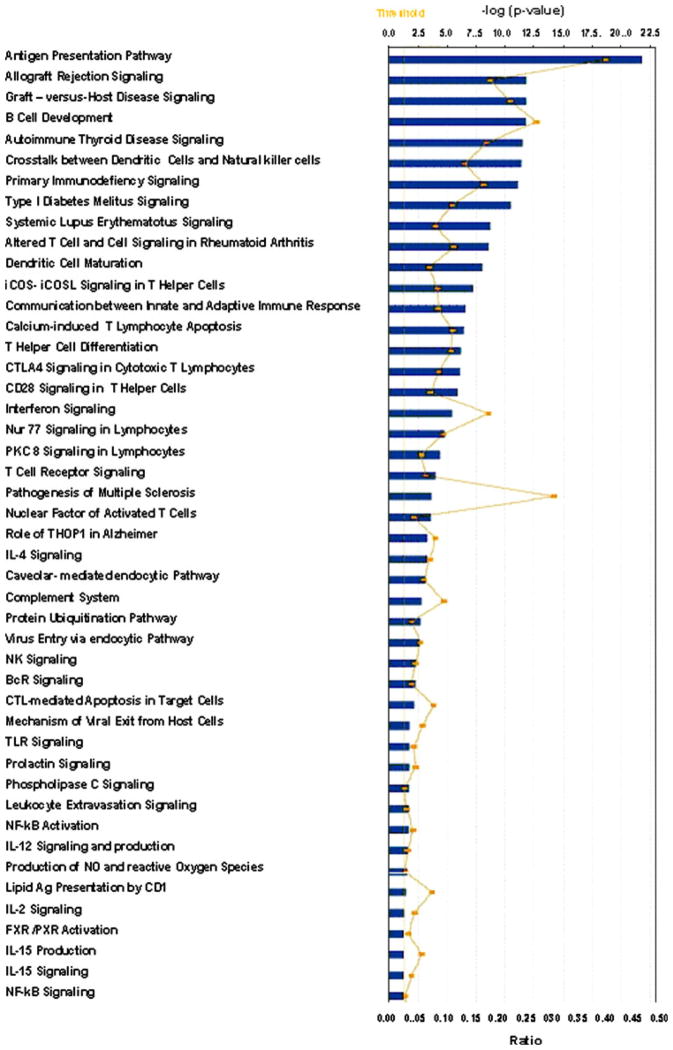
Fig. 4.
Ingenuity pathway analysis. Forty-six canonical pathways significant at the nominal 0.001 level of the unpaired Student’s t test. The P value for each pathway is indicated by the bar and is expressed as –1 times the log of the P value. The line represents the ratio of the number of genes in a given pathway that meet the cutoff criteria divided by the total number of genes that make up that pathway

