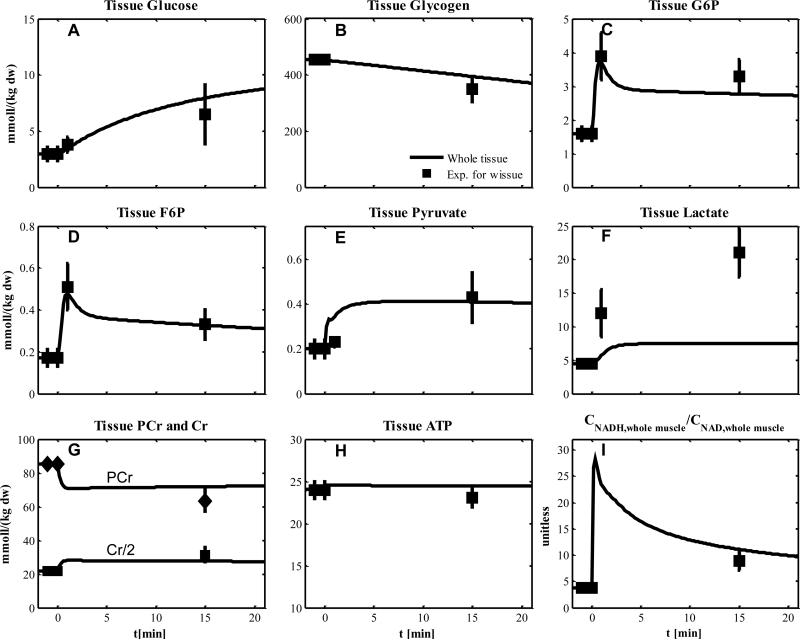
Figure 5.
Simulated dynamics and experimental data for intracellular species concentrations in whole muscle in response to an increased work rate equivalent to cycle ergometer exercise at 60% VO2max: for subjects corresponding to Experiment 3 (A) Glucose; (B) Glycogen; (C) Glucose-6-phosphate (G6P); (D) Fructose-6-phosphate (F6P); (E) Pyruvate, (F) Lactate; (G) Phosphocreatine and creatine, the experimental data and simulation of Cr were divided by 2 to distinguish the response of PCr and Cr; (H) ATP; (I) Tissue redox state (NADH/NAD+ ratio). Experimental data are means ± standard error for whole tissue.

