Figure 4.
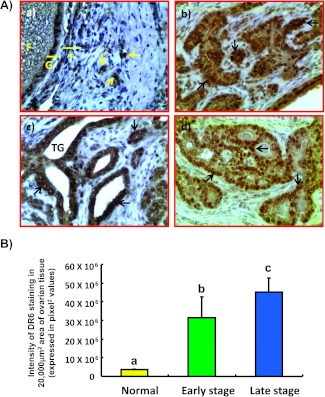
(A) Expression of DR6 by tumor cells in malignant ovaries in hens. (a) Section of a normal ovary immunostained for DR6 expression. Very few immunopositive cells are present in the ovarian stroma. (b-d) Sections of different histologic subtypes of OVCA in hens including serous (b), endometrioid (c), and mucinous (d) at early stages immunostained for DR6 expression. Compared with the normal OSE cells, tumor cells in all three histologic subtypes stained intensely. Original magnification, x40. (B) Changes in the DR6 staining intensity relative to ovarian tumor development and progression in hens. The intensity of DR6 staining is expressed as the pixel values (mean ± SD) in a 20,000-µm2 area in normal ovarian stroma (n = 15) or in malignant ovaries. Compared to the normal ovary, the intensity of DR6 staining was significantly (P < .001) higher in hens with early-stage OVCA (n = 15) and increased further (P < .001) in late-stage OVCA (n = 15). Each bar with different letter indicates significant differences (P < .001) among normal or OVCA stages.

