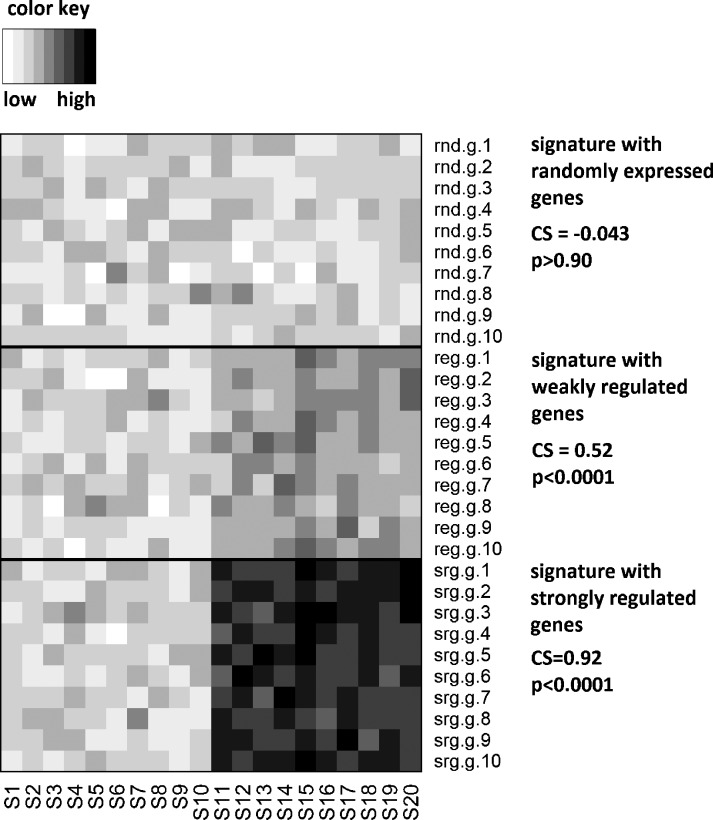
Figure 1.
The signature CS for simulated signatures. Here we show three examples of the signature coherence score for simulated gene expression signatures. Background signature values were simulated for a matrix of g = 1000 genes and n = 20 samples by sampling from a normal distribution with a mean of zero and a standard deviation of one. For values associated with genes 1 to 10 and samples 11 to 20, we added a constant c ε [0, 2, 4] to this random data matrix, thereby simulating no, weak, or strong differential expression between samples 1 to 10 and 11 to 20 for the first 10 genes of the data matrix. These 10 genes were now considered the signature under study. The CS was calculated (Materials and Methods) and its significance of deviation from the described randomization tests was determined. For the random signature, we found CS = 0.043 with P > .90. For the weakly deregulated signature, we found CS = 0.52 with P < .0001. For the strongly deregulated signature, we found CS = 0.92 with P < .0001. Thus, the CS score was strongly dependent on the introduced signal. It can be used as an indicator of common regulation (coherence) of signature gene expression.

