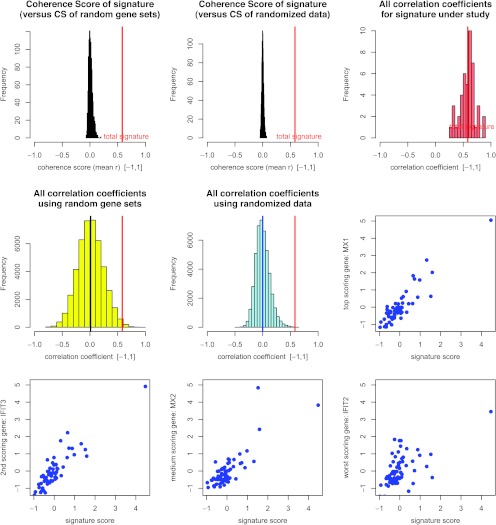
Figure 2.
Validation of the medulloblastoma IFN signature. Here we show diagnostic plots of the medulloblastoma 10-gene IFN signature in the Kool et al. validation data set. A red vertical line marks the CS score of the med-IFN signature throughout the plots. Top left: The signature coherence score (red) compared to 10,000 coherence scores obtained for random gene sets. Top middle: The signature coherence score (red) compared to 10,000 coherence scores obtained for randomly permuted versions of the IFN signature. Top right: IFN signature coherence score compared to all correlation coefficients from which it is derived. Mid row/left column: gene-versus-gene correlation coefficients for random gene sets. Middle row/middle column: gene-versus-gene correlation coefficients for the randomly perturbed signature. Middle row/right column: Scatterplot of MX1 signals across tumors and IFN signature scores across tumors. MX1 is the gene that best correlates to the IFN signature score. Bottom left: Scatterplot of IFIT3 signals across tumors and IFN signature scores across tumors. IFIT3 is the gene that second best correlates to the IFN signature score. Bottom/middle: Scatterplot of MX2 signals across tumors and IFN signature scores across tumors. MX2 is a gene with median correlation to the IFN signature score. Bottom right: Scatterplot of IFIT2 signals across tumors and IFN signature scores across tumors. IFIT2 is the signature gene with lowest correlation to the IFN signature score.

