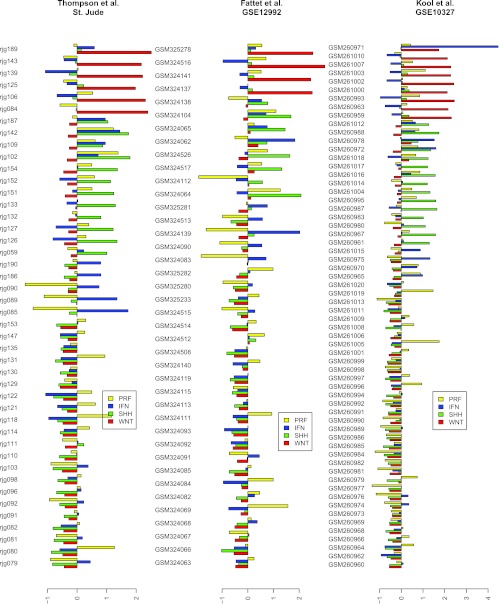
Figure 4.
Pathway signature scores in all three data sets. Here we show bar plots of scores for the interferon signature (IFN), Wnt pathway activation signature (WNT), Sonic Hedgehog pathway activation (SHH), and proliferation signatures (PRF) for each patient in the three medulloblastoma cohorts under study. Identifiers for each patient are given as GEO sample IDs or as microarray IDs of the St. Jude study.

