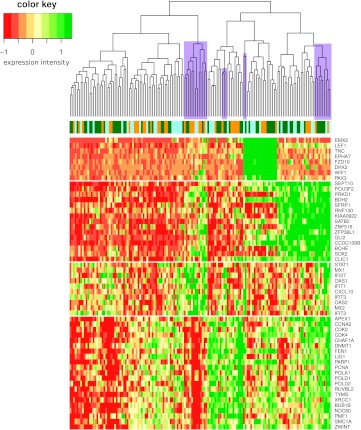
Figure 5.
Hierarchical clustering of a combined medulloblastoma data set. A heat map of a medulloblastoma data set composed of gene-wise z-normalized expression data for 146 medulloblastomas from the studies of Thompson, Fattet, and Kool is shown. Columns/samples are hierarchically clustered (average linkage, Euclidean distance). Genes are ordered by membership to WNT, SHH, IFN, and PRF signatures. Top coloring reflects which sample belongs to which original data set (blue - Thompson, orange - Fattet, green - Kool). Note how clustering is dominated by WNT and SHH genes. IFN-high samples (marked in magenta) are rather distributed among all WNT-low samples and often have a PRF-low expression phenotype.

