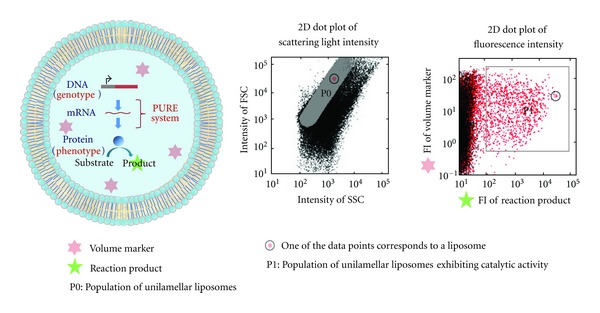
Figure 5.

Characterization of in-liposome protein synthesis using an FACS. DNA, PURE system, fluorogenic substrate, and fluorescent volume marker are encapsulated in a giant unilamellar liposome (left). Subpopulation of unilamellar liposomes is represented by P0 in 2D dot plot of scattering light intensity (middle). Catalytic activity of enzymes expressed in liposomes is confirmed in P1 region of 2D dot plot of fluorescence intensity obtained by FACS measurement (right).
