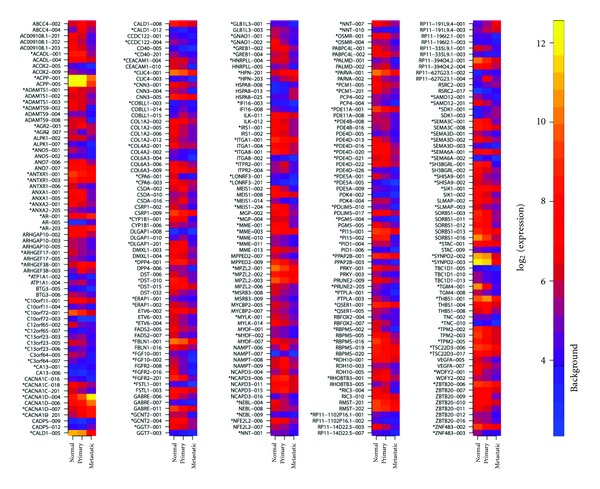
Figure 2.

Heat map of genes with two or more transcripts differentially expressed across any pairwise comparison. Transcript names are provided as annotated in Ensembl. Heat map is colored according to median expression values for normal, primary and metastatic samples. “∗” indicates that the transcript is protein-coding. Background indicates the expression value considered as background level based on control probe sets on the HuEx array.
