
Figure 2.
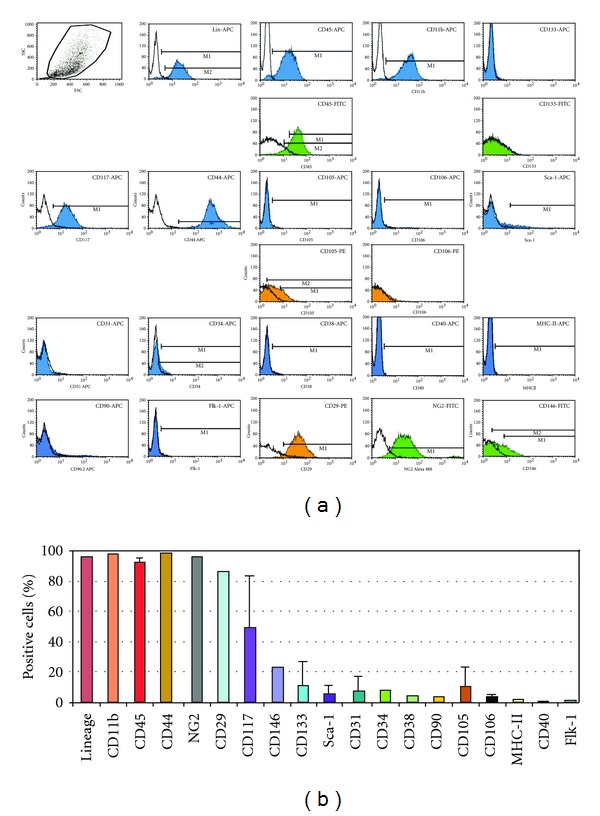
Flow cytometric analyses of the cell-surface marker profile of pancreas outgrowth-derived cells. (a) Representative analysis of cell-surface marker expression of cells cultured 2 months in MesenCult. Blue, green, and orange colors indicate APC, FITC, and PE fluorochromes, respectively. Selected markers (CD45, CD105, CD106, and CD133) were determined with two different fluorochromes. (b) Mean percentages (±SD) of cells expressing the indicated cell-surface markers (n = 6 analyses; 3–5 samples for each marker, excepted for a subset of markers [NG2, CD29, CD146, CD34, CD38, MHC-II, CD40, and Flk-1] for which a single measure is available).