Figure 2.

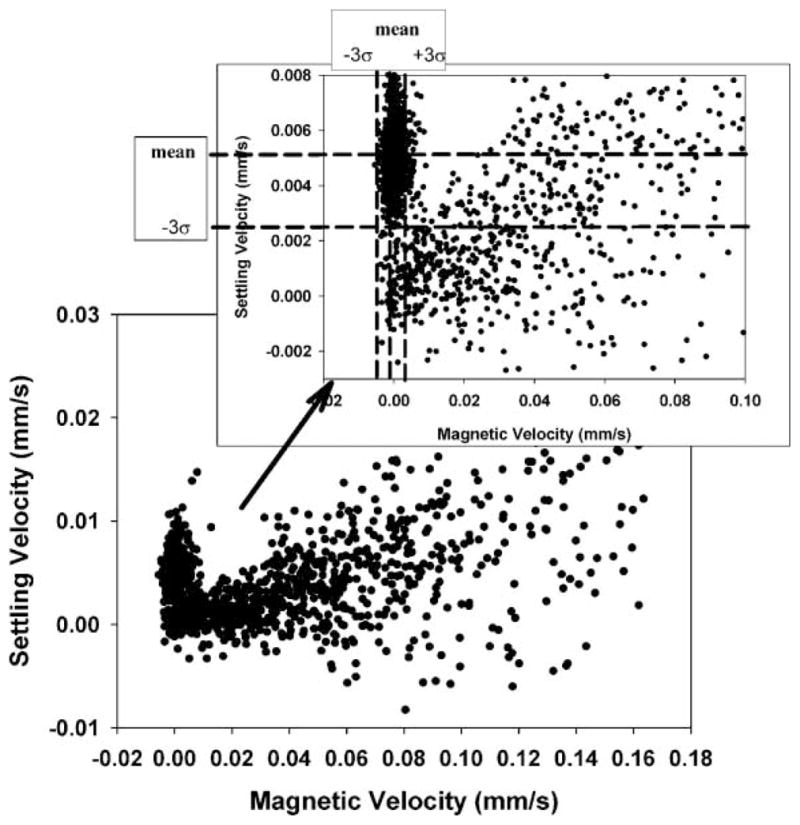
Dot plots of a full scale, CTV measurement of Bacillus spores mixed with 15.3 μm PSM, and inset is an expended scale, dot plot with mean and three standard deviations of the PSM, derived from independent analysis of the PSM.

Dot plots of a full scale, CTV measurement of Bacillus spores mixed with 15.3 μm PSM, and inset is an expended scale, dot plot with mean and three standard deviations of the PSM, derived from independent analysis of the PSM.