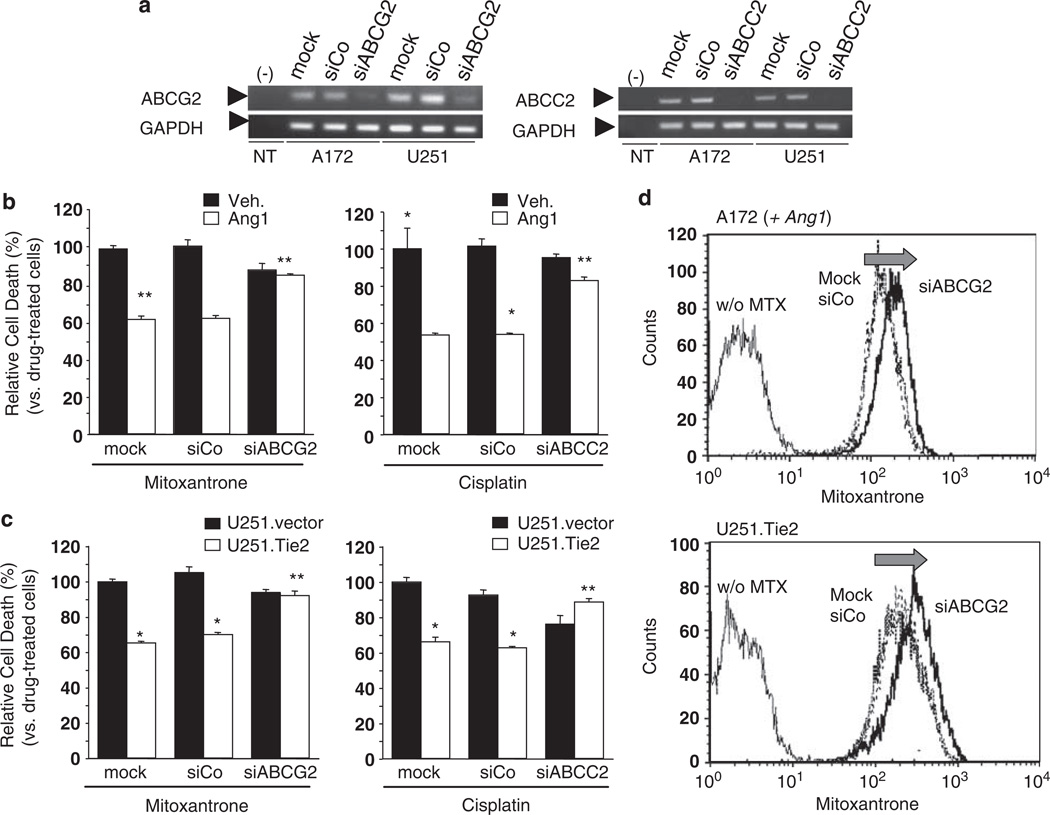
Figure 4.
Tie2-induced chemoresistance is mediated by upregulation of ATP-binding cassette (ABC) transporters. (a) Reverse transcriptase (RT)–PCR showing a decrease in the ABCG2 and ABCC2 RNA levels in the A172 and U251 MG cells 48 h after transfection of siRNA against ABCG2 (siABCG2), siRNA against ABCC2 (siABCC2), control siRNA (siCo) (50 nm; Ambion Inc., Applied Biosystems, Foster City, CA, USA), or mock-treated cells. Glyceraldehyde-3-phosphate dehydrogenase (GAPDH) amplification was used as the internal control. NT, no DNA template. (b) Drug-induced cell death in A172 human glioma cells after incubation with ABCG2 siRNA or ABCC2 siRNA. Cells were then treated overnight with angiopoietin 1 (Ang1, 250 ng/ml) or vehicle, and mitoxantrone (500 nm) or cisplatin (100 µm) were added to the cultures. After 48 h, cell viability was measured by 3-(4,5-dimethylthiazol-2-yl)-2,5-diphenyltetrazolium bromide (MTT) reduction assay. The relative drug-induced cell death is represented as the mean ± s.d. of three independent experiments performed in triplicate (cell death induced by drug in untreated A172 was set equal to 100%). (c) Drug-induced cell death in the U251 MG cells treated with mitoxantrone (500 nm) after incubation with ABCG2 siRNA, or cisplatin (10 µm) after incubation with ABCC2 siRNA. After 48 h, cell viability was measured by MTT reduction assay. Relative drug-induced cell death is represented as the mean ± s.d. of three independent experiments performed in triplicate (cell death induced by drug in mock-treated U251.vector was set equal to 100%). *P < 0.01 vs either vehicle- or mock-treated (A172) or U251.vector cells (one-way analysis of variance (ANOVA) followed by a Student–Newman–Keuls multiple range test). (d) Mitoxantrone incorporation functional study in Ang1-stimulated A172 and U251.Tie2 cells after downmodulating ABCG2 expression. Cells were transfected with siRNA against ABCG2 or control siRNA (both 50 nm), and 48 h later, they were treated with mitoxantrone (MTX; 1 µm) or the vehicle for 30 min. Cells were then washed, allowed to incubate for 1 h in mitoxantrone-free media and then fluorescence was determined as explained in Figure 3. Shown are representative results from one of the three independently performed experiments.

