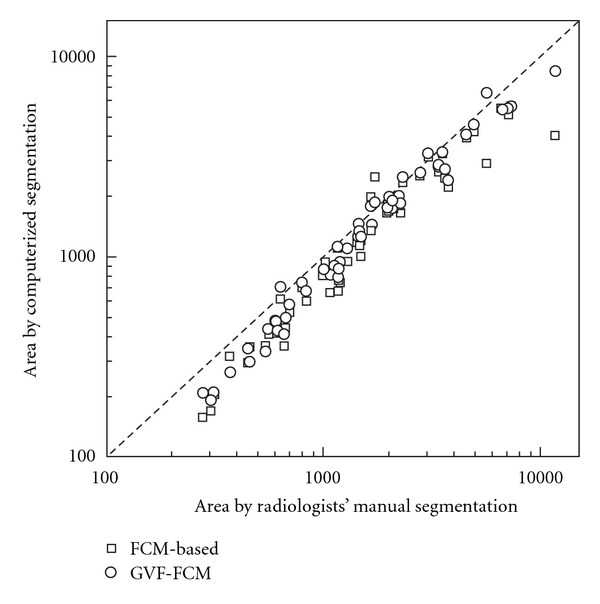
Figure 3.

Scatter plot of the lesion areas segmented by computerized and radiologists' manual delineation. The diagonal line is represented the most perfect segmentation performance. Square is for areas segmented by FCMs-based initial method, circle is for areas extracted from GVF-FCMs method.
