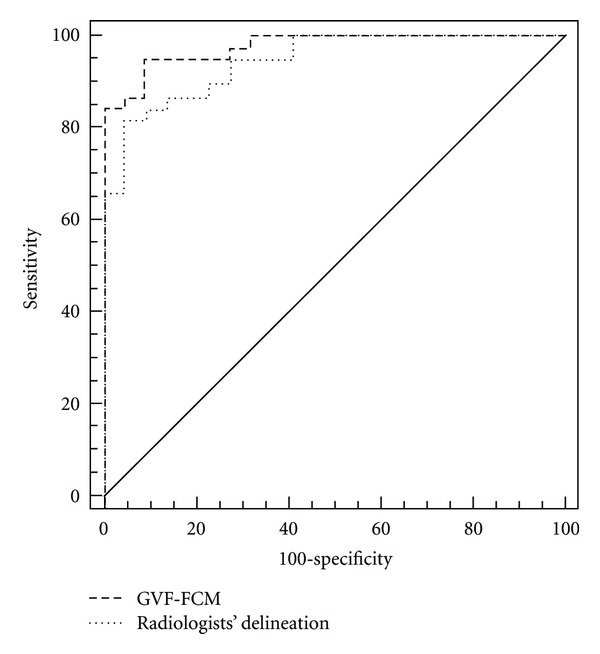
Figure 5.

The ROC curves of classifer based on FSDA method by different features extracted by GVF-FCMs and radiologists' manual segmentation methods, respectively. The dotted line represented the ROC curve from radiologists' manual segmentation method with AUC of 0.914. The dash line denoted the ROC curve from computerized method (GVF-FCMs) with AUC of 0.968.
