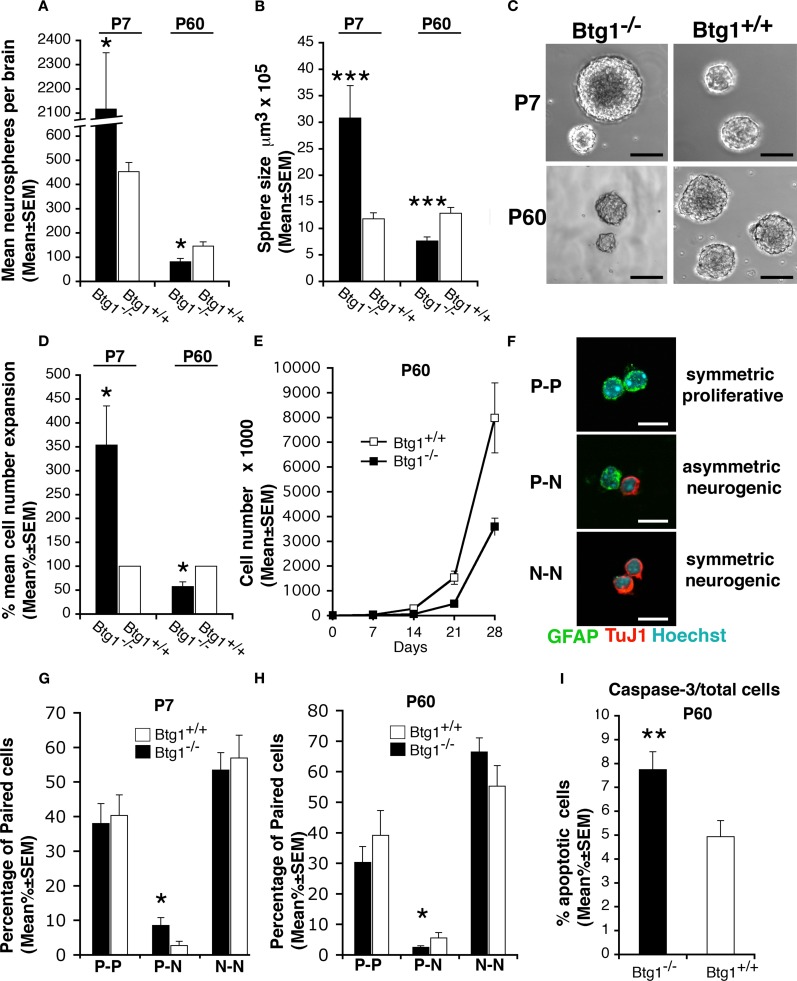
Figure 8.
Btg1 loss results in an initial expansion of neural stem cells in vitro, followed by an age-dependent decrease of proliferative capacity, self-renewal, and survival. (A) Number (mean ± SEM) of clonal neurospheres derived from the subependyma of the lateral ventricle from Btg1-null and wild-type P7 or P60 mice (n = 4 and 5, respectively). Relative to control mice, neurospheres generated from P7 Btg1-null mice increased strikingly in number, while those generated from adult P60 mice decreased. (B) Volumes (mean ± SEM) of secondary neurospheres derived from Btg1-null and wild-type mice aged P7 or P60 (n = 4 and 5, respectively). With respect to wild-type mice, the volume of neurospheres from P60 Btg1-null mice was lower, after an initial increase observed in neurospheres from P7 mice. (C) Representative images of secondary neurospheres derived from Btg1-null and wild-type mice aged P7 or P60. Scale bars, 115 μm. (D) Percentage of cell expansion of primary neurosphere cultures from Btg1-null and wild-type mice (total number of cells at the end of culture divided by the initial number of cells; represented as mean percentage ± SEM, wild-type set to 100%). Relative to control, a greater expansion occurred in cells from P7 Btg1-null mice, whereas the expansion of cells derived from P60 Btg1-null mice was considerably lower (n = 4 and 5, respectively). (E) Growth curve displaying the amplification of 8000 cells derived from secondary neurospheres plated at t0, from P60 mice either Btg1-null or wild-type (n = 3). The amplification of Btg1-null cells is reduced in the long term, relative to wild-type cells. (F) Representative images of three different types of daughter-cells originating from individual NSPs from SVZ: two glial astrocytic-like proliferating progenitor cells (P–P; both labeled by GFAP), one glial astrocytic-like proliferating progenitor cell and one postmitotic neuron (P–N; labeled by GFAP and the neuronal marker TuJ1, respectively), and two postmitotic neurons (N–N; TuJ1+/TuJ1+). Scale bar 10 μm. (G,H) Quantification of the percentage of P–P, P–N, and N–N daughter-cells pair from SVZ of P7 and P60 Btg1-null and control mice. Cells counted: n = 198 and 330 for P7 Btg1+/+ and Btg1−/− mice, respectively; n = 248 and 192 for P60 Btg1+/+ and Btg1−/− mice (at least three mice per age). (I) Percentage of apoptotic cells in secondary neurospheres (mean percent ± SEM), detected as positive to activated Caspase-3. Cells from P60 Btg1-null presented a frequency 1.6-fold higher than control. *p < 0.05, **p < 0.01, or ***p < 0.001 vs. Btg1+/+; Student’s t-test.

