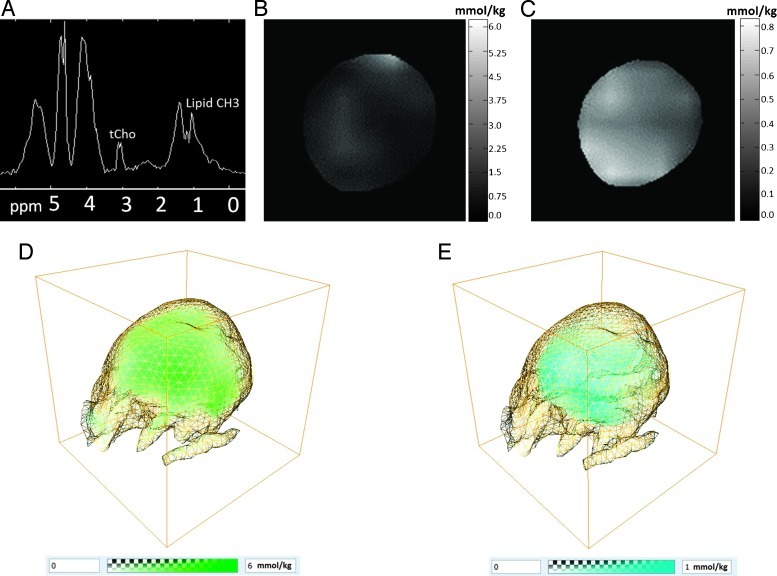
Figure 2.
(A) Example of a water-suppressed 1H CSI MRSI spectrum from a representative MDA-MB-231-HRE-tdTomato tumor (approximately 360 mm3) obtained with a spatial resolution of 0.9 x 0.9 x 0.8 mm showing tCho at 3.2 ppm and lipid CH3 at 0.9 ppm. (B) Example of a two-dimensional tCho concentration map obtained from the signal at 3.2 ppm in the water-suppressed MRSI data (TE = 82 milliseconds). (C) Example of a two-dimensional lipid CH3 concentration map obtained from the signal at 0.9 ppm in the water-unsuppressed MRSI data (TE = 15 milliseconds). Example of (D) a three-dimensional tCho concentration volume (green) and (E) a three-dimensional lipid CH3 concentration volume (cyan) with the tumor boundary shown as a yellow grid.

