Figure 5.
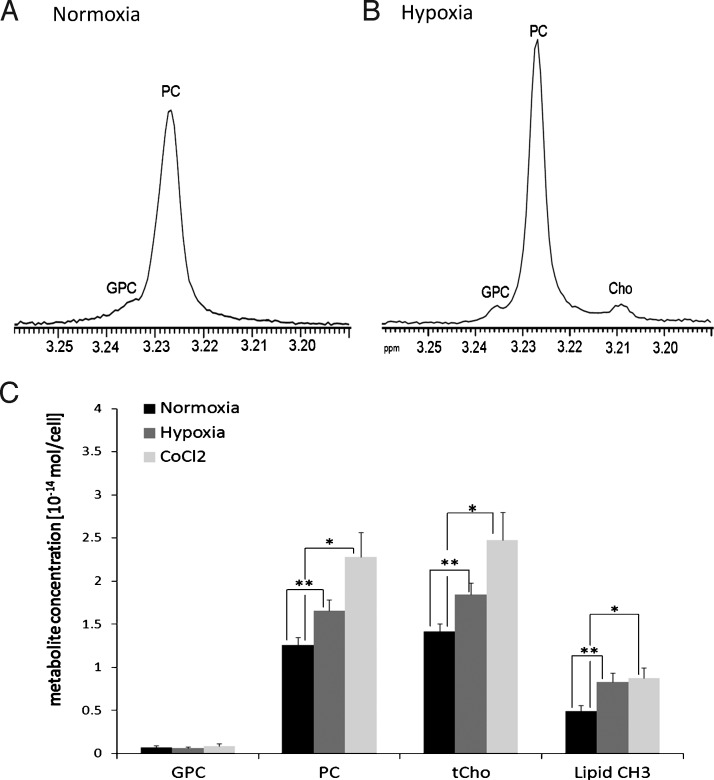
Expanded regions of representative high-resolution 1H MR spectra of MDA-MB-231-HRE-tdTomato breast cancer cell extracts after 24 hours of (A) normoxia or (B) hypoxia. Both samples are from approximately 3 x 10⁷ cells. (C) Average concentration of GPC, PC, PC/GPC, tCho, and lipid CH3 quantified from 1H MR spectra obtained from MDA-MB-231-HRE-tdTomato cells exposed to normoxic control conditions, hypoxia, or CoCl2. Values are mean ± SE. *P < .05, **P < .01.

