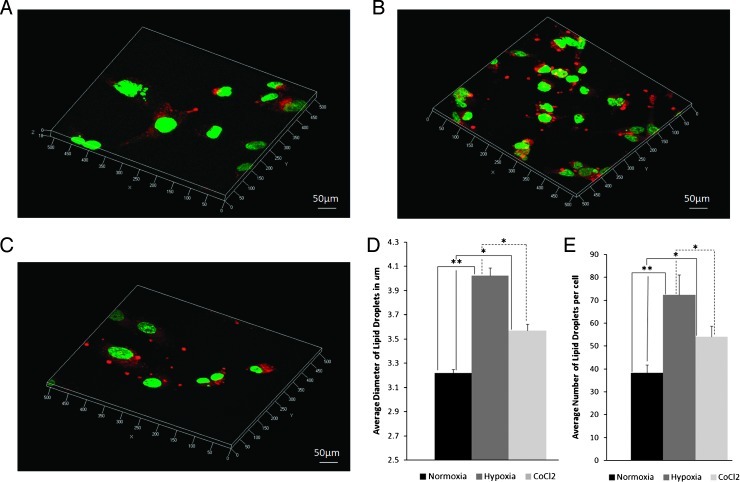
Figure 6.
Three-dimensional confocal microscopic z-stack images of Nile Red-stained MDA-MB-231-HRE-tdTomato breast cancer cells after 24 hours of (A) normoxia, (B) hypoxia, and (C) CoCl2 exposure. (D) Average diameter and (E) average number of lipid droplets after 24 hours of normoxia, hypoxia, or CoCl2 exposure. Quantitative analysis was performed from 21 randomly selected FOVs. Values are mean ± SE. *P < .05, **P < .01.

