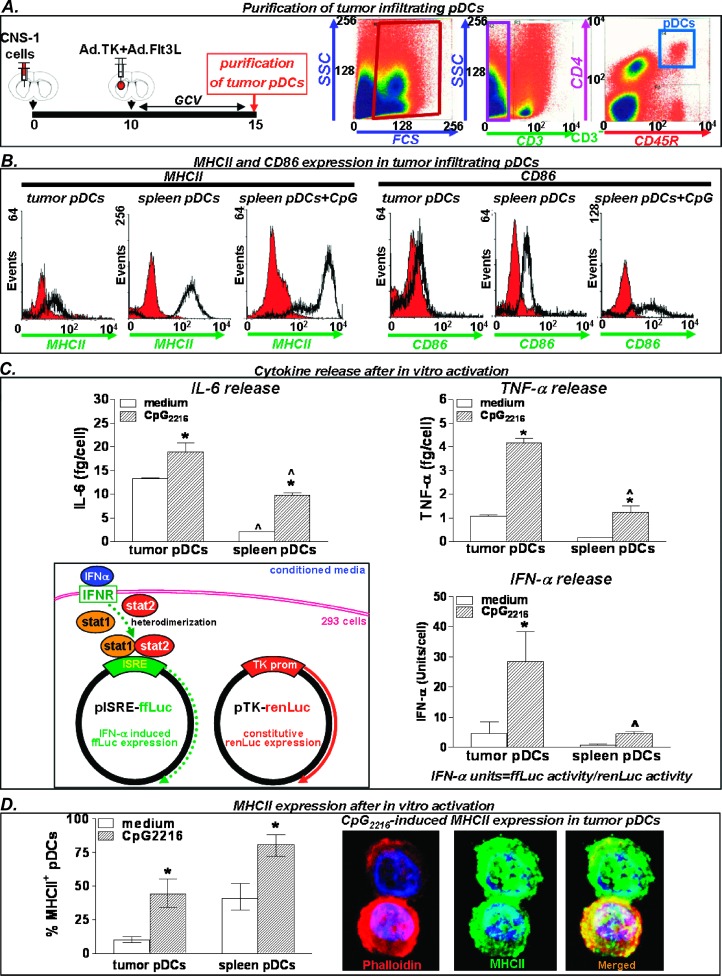
Figure 2.
Activation markers and cytokine release in tumor-infiltrating pDCs. (A) Immune cells from CNS-1 tumors were collected 5 days after treatment with Ad.TK + Ad.Flt3L and CD3-CD45R+CD4+ cells were purified by flow cytometric cell sorting. Cells were characterized by expression of activation markers and cytokine release. (B) Expression of activation markers CD86 and MHC II was determined by flow cytometry. Naive spleen pDCs incubated 24 hours with ODN CpG2216 were used as positive controls. (C) Cytokine release was determined in tumor-infiltrating pDCs and naive spleen pDCs after incubation with ODN CpG2216 for 24 hours. IL-6 and TNF-α expressions were detected by ELISA, and IFN-α expression was assessed by a biologic assay using the pISRE plasmid. *P < .05 versus medium; ^P < .05 versus tumor pDCs. Two-way ANOVA followed by Student-Newman-Keuls test. (D) Columns represent the percentage of pDCs expressing MHC II, as determined by immunofluorescence, after incubation with ODN CpG 2216 for 24 hours. Pictures in the right show ODN CpG2216-induced MHC II expression in tumor-infiltrating pDCs (green). Cytoskeleton was stained with phalloidin-Alexa 594 (red). Nuclei were stained with DAPI.

