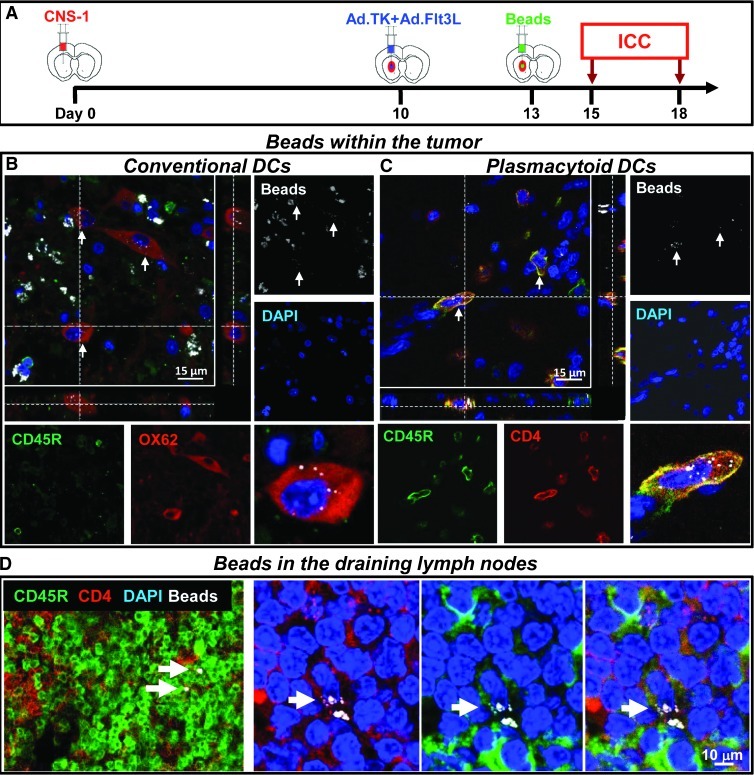
Figure 3.
Phagocytic activity by cDCs and pDCs. (A) Three days after treatment with Ad.TK + Ad.Flt3L tumor-bearing rats were injected intratumorally with fluorescent microbeads. Two days later, the brains immune cells were detected by immunofluorescence. Bar, 15 µm. (B) Confocal microphotograph showing tumor-infiltrating cells expressing the cDC marker OX62 (red) containing beads (white) in the cytoplasm (indicated by arrows). (C) Confocal microphotograph showing tumor-infiltrating cells expressing the pDC markers CD45R (green) and CD4 (red) and containing beads (white) in the cytoplasm (indicated by arrows). (C) Confocal microphotograph showing cells in the cervical lymph nodes expressing the pDC markers CD45R (green) and CD4 (red) and containing beads (white) in the cytoplasm (indicated by arrows). Nuclei were stained with DAPI (blue). Bar, 10 µm.

