
Figure 1. Mapping of Interacting Domains.
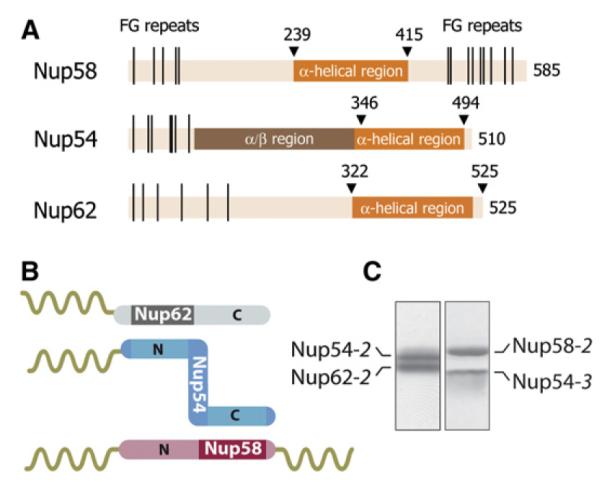
(A) Domain representation of Nup58, Nup54, and Nup62 from Rattus norvegicus indicating α-helical (dark orange), α/β (brown), and unstructured regions (light orange) with FG repeats (black lines) (Melčák et al., 2007).
(B) Schematic representation of binding sites on Nup54 (blue) for Nup62 (gray) and Nup58 (pink). The α-helical and the unstructured regions with FG repeats are visualized as rods and coils, respectively.
(C) Coexpressed and purified Nup62-2·Nup54-2 (left) and Nup54-3·Nup58-2 (right) complexes were analyzed by SDS-PAGE and stained by Coomassie blue. See also Figure S1.