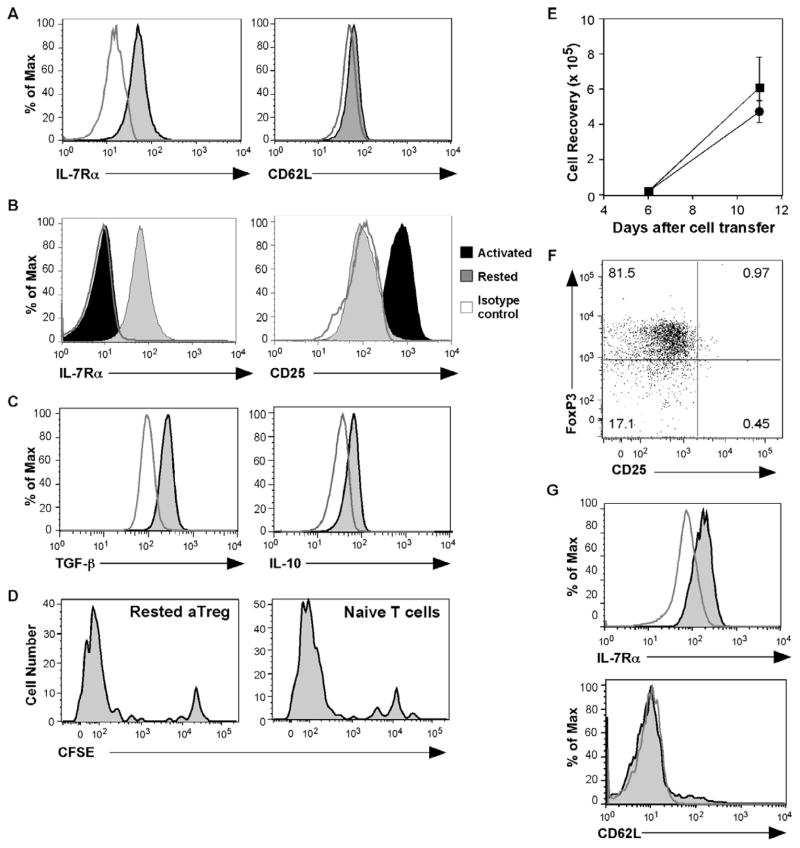
Fig. 2. IL-7Rαα α expression with the development of memory aTregs.
(A) IL-7Rα and CD62L expression were examined at 9 months after aTreg cell transfer and diabetes reversal. Shown are histograms of gated CD4+Thy1.1+ donor cells; the stained cells (shaded) are compared to isotype controls (open). (B) aTreg cells rested in the absence of rIL-7 for 3 days (gray histograms) were compared to aTreg cells immediately after differentiation (black histograms) for expression of IL-7Rα and CD25. The open histograms show isotype staining controls. (C) The rested cells were restimulated with PMA and ionomycin, and stained for intracellular TGF-β and IL-10. Shown are histograms of CD4+ gated T cells; the stained cells (shaded) are compared to isotype controls (open). (D – G) aTreg cells were differentiated and rested in the presence of rIL-7 (10ng/ml). The cells were then CFSE-labeled and transferred into NOD.Scid mice (n = 5). For comparison, naïve CD4 cells were also transferred (n = 4). (D) Eleven days after cell transfer, the cells were tested for proliferation by CFSE dilution in comparison to naïve CD4+ T cells. Shown are representative histograms after gating on CD4+Thy1.1+ donor cells from the spleen. (E) The recovered naïve donor cells (squares) or aTreg donor cells (circles) from the spleens were enumerated (mean ± SEM). (F) The expression of FoxP3 and CD25 is shown on a representative dot plot on gated CD4+Thy1.1+ donor cells. (G) IL-7Rα and CD62L were examined after gating on CD4+Thy1.1+ cells. Shown are representative histograms of antibody staining (shaded) compared to isotype control staining (open) on gated CD4+Thy1.1+ donor cells.

