
Figure 3 .
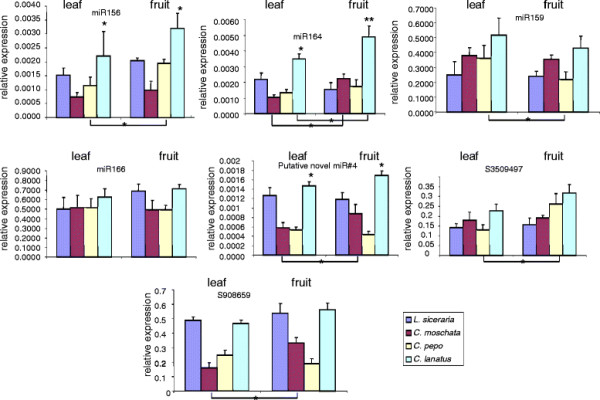
Expression profiling of conserved and putative novel miRNAs in leaf and fruit tissues of different cucurbits by qPCR analysis. The asterisks indicate that the expression values were significantly different. Asterisks with connecting line indicate differences in expression levels of leaf and fruit tissues in the same species that are significant (*: P <0.05; **: P < 0.01; Student’s t test).