
Figure 3.
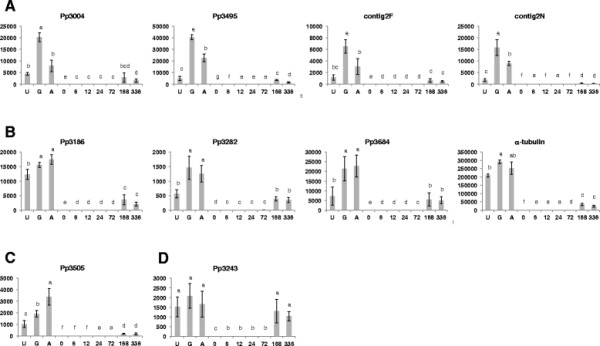
Absolute quantification of mRNA transcripts of selected ESTs during the infection cycle. Soybean cultivar Williams 82 was inoculated with Phakpsora pachyrhizi isolate Taiwan 72-1. RNA was extracted from leaves collected at 0, 6, 12, 24, 72, 168, and 336 hours post inoculation. RNA was also extracted from urediniospores (U), urediniospores germinated for 6 hours on the surface of water (G), and urediniospores germinated for 6 hours on an appressoria-inductive surface (A). The y-axis represents absolute expression of these transcripts. Error bars represent the standard deviation. Bars topped with different letters are significantly different (P < 0.05). Group A had highest expression in germinated urediniospores. Group B showed highest expression in both germinated urediniospores and appressoria, and lower expression in urediniospores. Group C had highest expression in appressoria and lowest expression in urediniospores.