Figure 2.

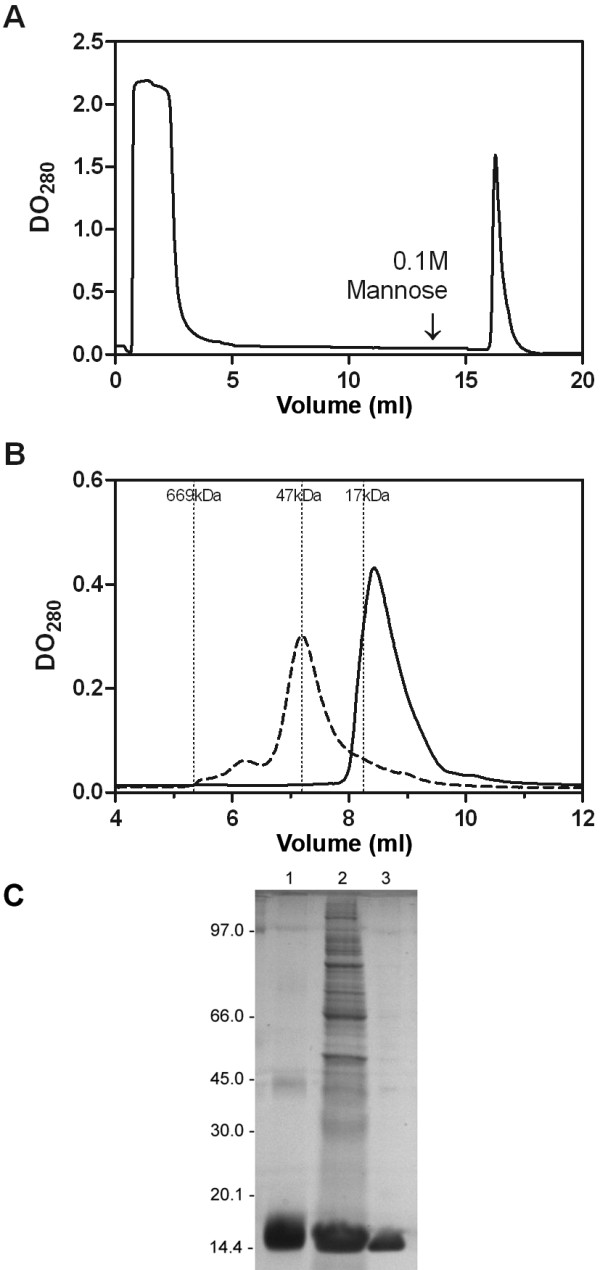
Purification of rArtinM.A) Elution profile of rArtinM on d-mannose-Sepharose affinity column. The solid line corresponds to protein elution as monitored by measuring absorption at 280 nm. The arrow shows the d-mannose load. B) Size exclusion chromatogram showing jArtinM (dashed line) and rArtinM (solid line) elution. Positions of molecular weight standards are marked. C) SDS-PAGE analysis of rArtinM. Lane 1 - purified jArtinM loaded as control. Lane 2 - whole bacterial cell lysate. Lane 3 - rArtinM purified by affinity column. Each lane contains 3 μg of protein.
