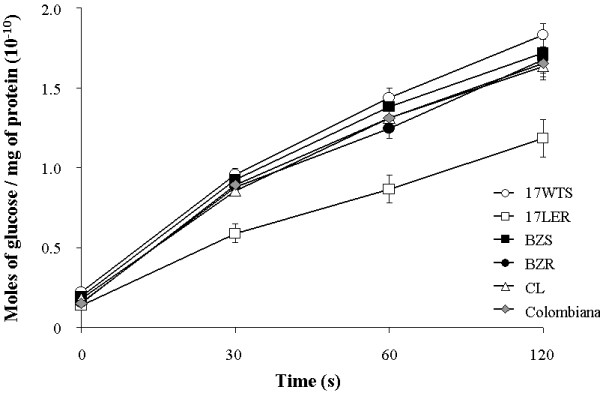
Figure 5.
Comparison of hexose transporter activities among BZ resistant and susceptibleT. cruzipopulations and strains showing the quantities of 6-deoxy-D-[6-3 H] glucose transported per mg of total protein as a function of time. The values shown represent the means of three independent experiments and the error bars indicate the standard error of the mean (± SEM). The mean values for 17 WTS and 17 LER are significantly different (p <0.001), whilst the BZR versus BZS and the Colombiana versus CL mean values show no such differences (p = 0.072 and p = 0.5, respectively).

