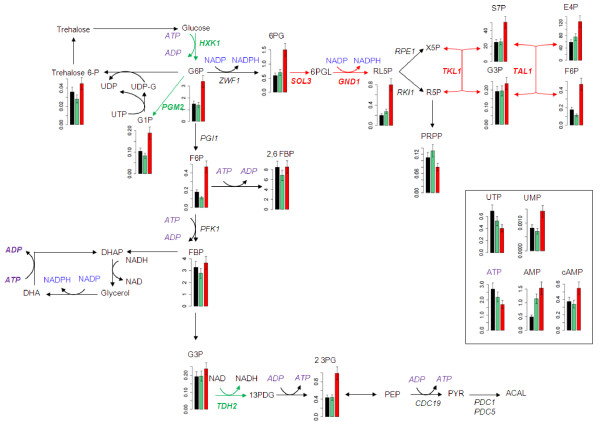
Figure 6 .
Intracellular metabolite concentrations for the glycolysis, PP and carbohydrate pathways, following changes to NADPH demand. Intracellular metabolite concentrations (μmol/gDW) for NADPH-Bdh in the presence of 100 (black), 200 (green) and 300 (red) mM acetoin. The genes upregulated and downregulated in the NADPH-Bdh strain in the presence of 300 mM acetoin are indicated in red and green, respectively.

