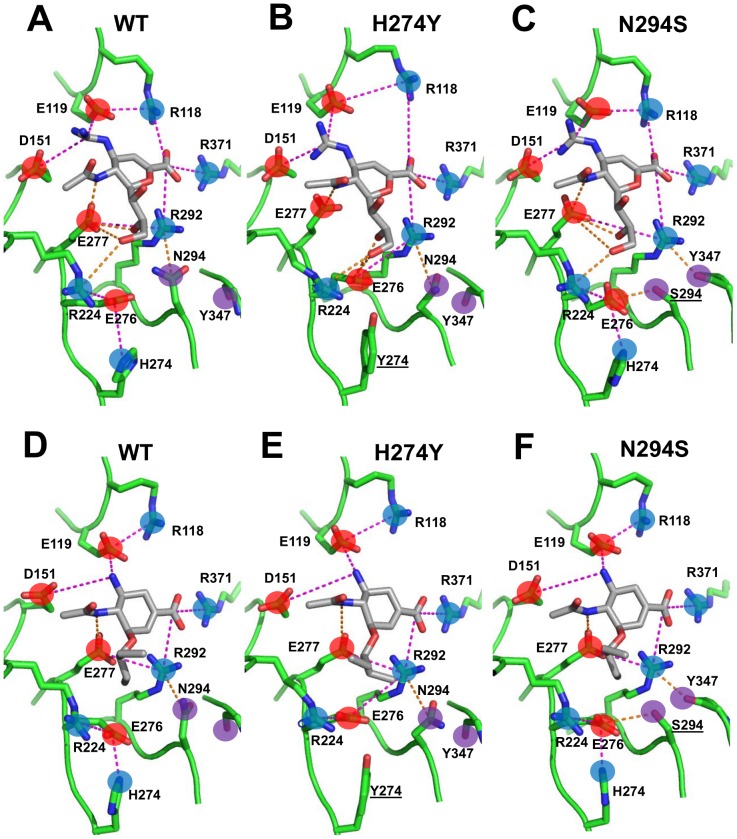
Figure 2. Representative structures for zanamivir (A, B and C) and oseltamivir (D, E and F) bound to WT and mutant NAs from the SRSM/HREX simulations.
Salt-bridges and hydrogen bonds are depicted as magenta and orange dashed lines, respectively. Positively charged, negatively charged, and uncharged polar groups are noted as blue, red, and purple circles, respectively, and residues of interest are labeled. Mutated residues are underlined.

