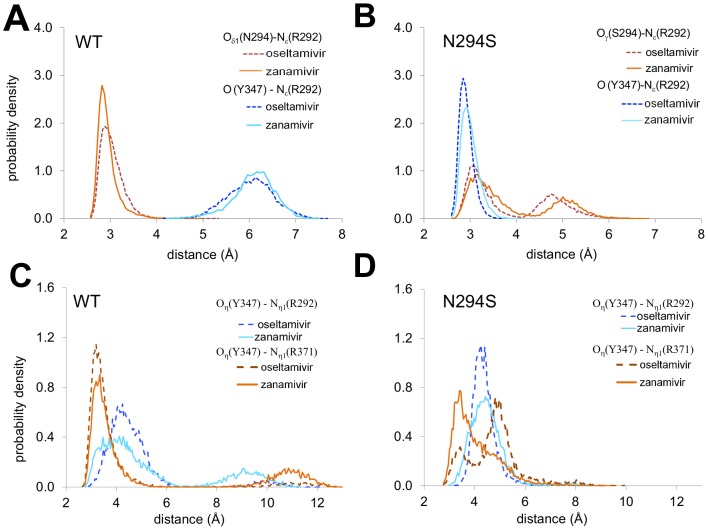
Figure 5. Comparison of WT and N294S mutant dynamics.
(A) Distance distributions between the R292 Nε atom and N294 Oδ1 and Y347 carbonyl O atoms computed from SRSM/HREX simulations of the WT enzyme in complex with oseltamivir and zanamivir. (B) Distance distributions between the Nε atom of R292 and S294 Oγ and Y347 carbonyl O atoms computed from simulations of the complexes of the N294S mutant with the two drugs. (C) Distributions of distances between the Y347 Oη atom and Nη1 atoms from R292 and R371 computed from SRSM simulations of the WT enzyme in complexes with the two drugs and (D) for the complexes of the N294S mutant with oseltamivir and zanamivir.

