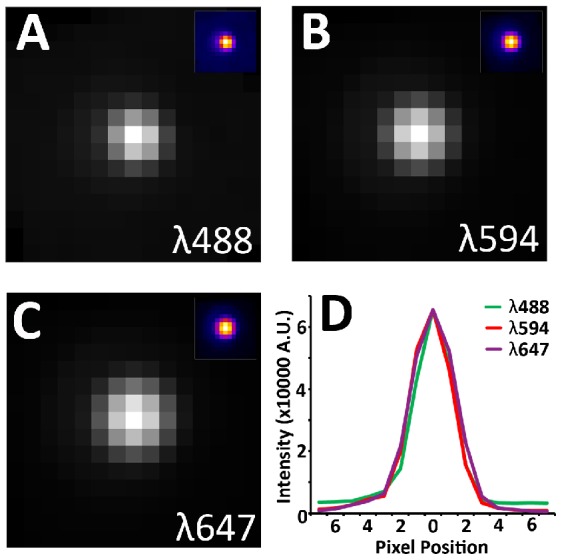
Figure 1. Empirically measure point spread functions (PSF).

110 nm Tetraspeck beads (Invitrogen) are suspended in ethanol. The solution is then applied to ultra-thin (70 nm) tissue arrays and let dry. The arrays are then mounted in mounting medium and imaged. Special care is made to ensure that no more than a single pixel per bead is saturated. Beads from multiple images across the entire field is registered and averaged to produce a single PSF. (A) PSF at 488 nm. Average of 268 beads. (B) PSF at 594 nm. Average of 282 beads. (C) PSF at 647 nm. Average of 335 beads. (d) Cross-sectional plot of each PSF. Note that the width of the PSF increases slightly with increased wavelength.
