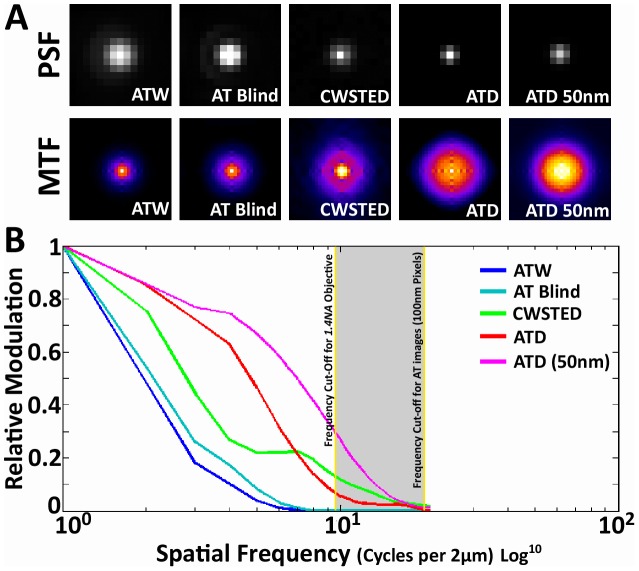
Figure 7. Comparison of measured MTFs.
(A) Top row: the PSFs of ATW, AT with blind deconvolution, STED and ATD. Bottom row: the calculated MTF of the above modalities, which we accomplished by performing a FT on the PSF and graphing the modulus or the real component of the FT as a 2D intensity plot. (B) A plot of the rotationally averaged MTFs of ATW, AT with blind deconvolution, ATD and CWSTED. Yellow lines denote the theoretical cut-off frequency for a 1.4NA objective is calculated using 2NA/λ (λ = wavelength-488 nm, NA = numerical aperture-1.4). The grey region represents the frequency domain that is between the diffraction limit and the pixel limit of AT images. The frequencies in this region are not present in the actual recorded image, and ATD's MTF extension into this region must be accounted for purely through analytical continuation by RL. In contrast, blind deconvolution does not apply analytical continuation and remains bandwidth limited by the cut-off frequency. CWSTED on the other hand clearly surpasses the diffraction limit and has 50 nm pixels. Further tests using ATD with 50 nm pixels (63× objective with 1.6× optivar) reveal that the MTF extension can be further pushed by allowing analytical continuation to continue further using a smaller pixel size.

