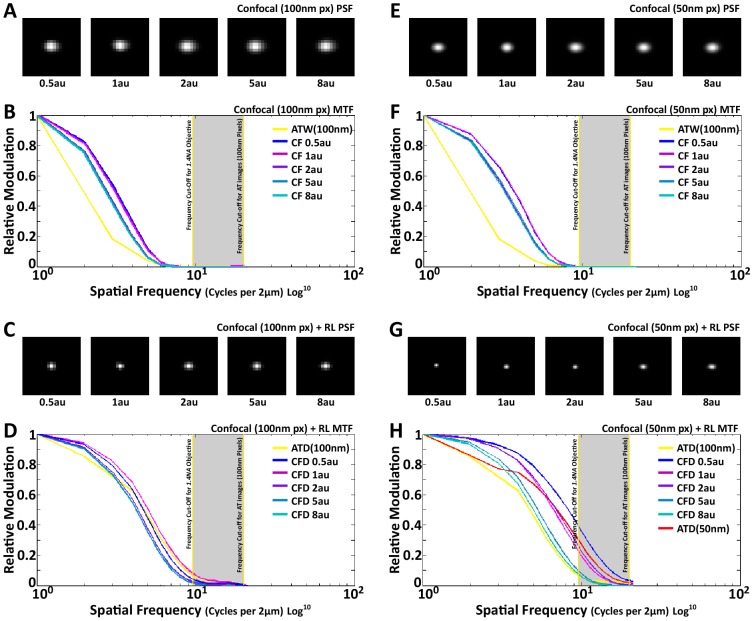
Figure 9. RL deconvolution of confocal images.
(A, C, E, G) Images of Confocal (CF) PSFs at different pinhole sizes for different pixels sizes and after deconvolution. Each PSF is an average of ∼200 individual images from 110 nm fluorescent beads. (B) MTF plot of CF with 100 nm pixels at different pinhole sizes, compared to ATW with 100 nm pixels. Note the increase in MTF magnitude for all CF cases as compared to ATW. (D) MTF of RL deconvolved confocal images (CFD) at 100 nm pixels as compared to ATD with 100 nm pixels. The magnitude of the MTF is comparable at the high spatial frequencies with CFD performing better at lower spatial frequencies. (F) MTF plot of CF with 50 nm pixels, which is very similar to (B), with a slight increase in MTF frequency. (H) MTF plot of CFD at 50 nm pixels, as compared to ATD at 100 nm and 50 nm pixels. It is clear that CFD at 50 nm completely out performs ATD at 100 nm. ATD at 50 nm perform closely with CFD in the high spatial frequencies, with the exception of CFD at 0.5 airy unit (au). At lower spatial frequencies, as seen in (D) as well, CFD out performs ATD.

