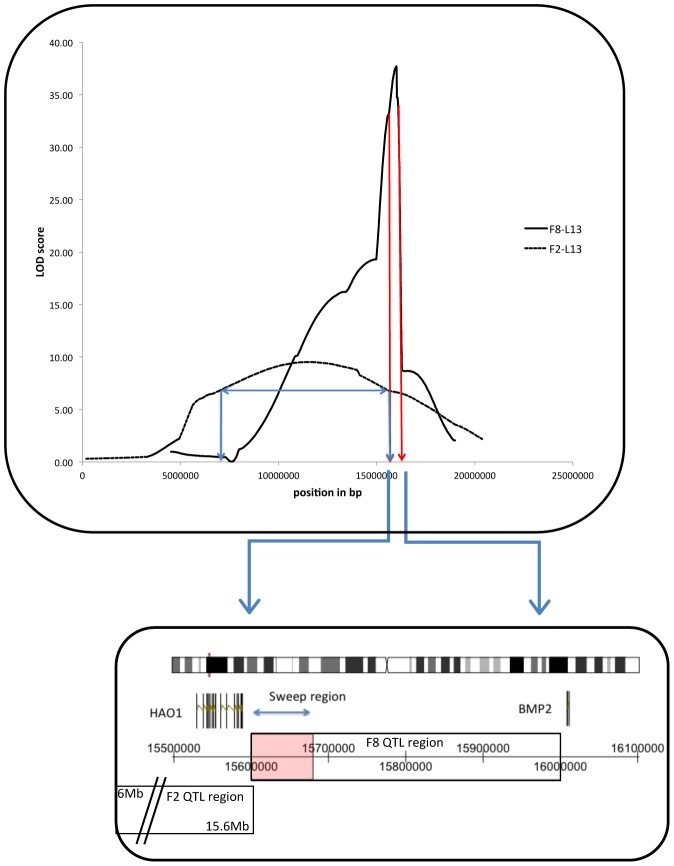
Figure 2. Chromosome 3 QTL peaks and confidence intervals (C.I.) from the F2-L13 (blue line) and F8-L13 (dark red line) crosses.
In the case of the F2-L13, the horizontal arrow indicates the 1.8 LOD drop C.I. of the QTL position. The location of the F8-L13 C.I. has been expanded below the graph to show the location of the two candidate genes and the selective sweep, and the overlap with the F2-L13 C.I.

