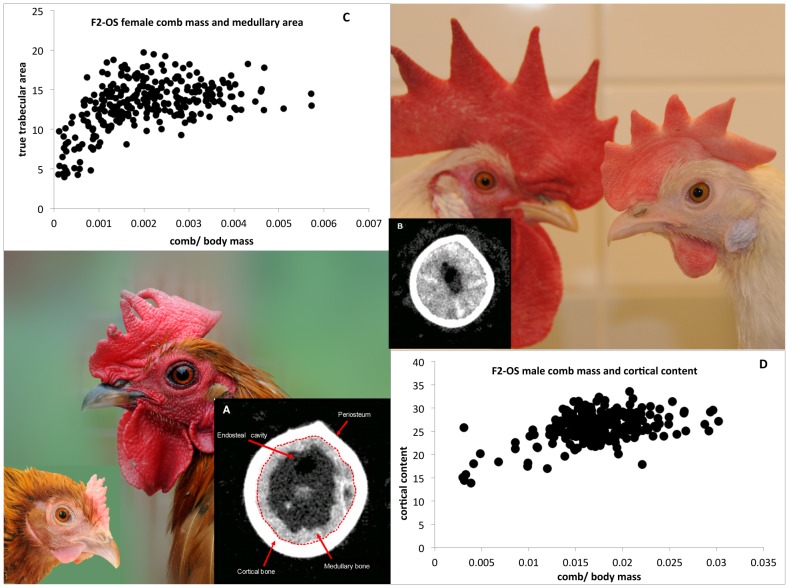
Figure 3. Illustration of male and female RJF (lower left) and WL (upper right) comb size.
CT pictures of two diaphyseal bone sections are shown in (A) and (B), with the cortical and medullary bone marked. The correlation between female comb mass relative to body mass and diaphyseal trabecular area shown in (C), and the correlation between relative male comb mass and cortical content is shown in (D).

