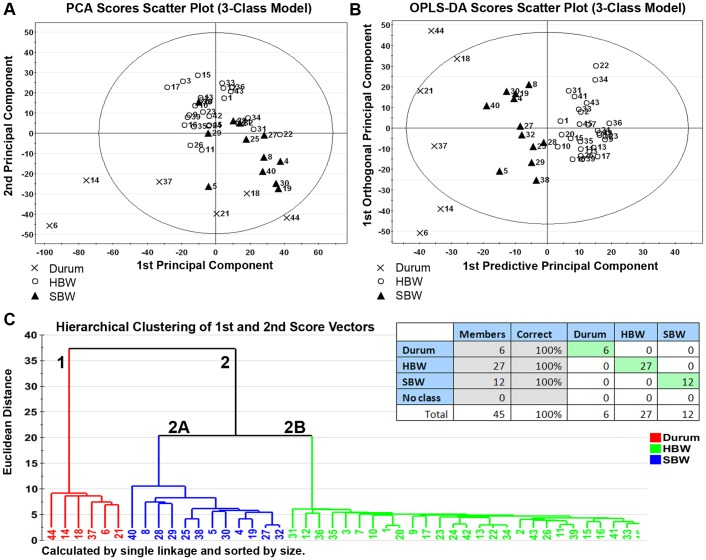
Figure 1. Metabolite profiling distinguishes between genetically distinct wheat classes with 100% accuracy.
Multivariate discriminant analysis of the high-quality ion list, consisting of 935 ions in 45 wheat lines, was used to distinguish between wheat classes of differing ploidy levels: tetraploid durum wheat (DW) vs. hexaploid bread wheat, which comprises hard (HBW) and soft (SBW) bread wheat. Each point represents a single observation (e.g. each wheat line). (Panel 1A) To visualize inherent clustering patterns, the scatter plot represents unsupervised analysis through the PCA 3-class model. Separation of DW lines from HBW and SBW lines is observed. Model fit: R2X(cum) = 68.6%, with 7 components, and Q2(cum) = 38.9%. (Panel 1B) To determine contributing sources of variation, the scatter plot represents supervised analysis of the 3-class OPLS-DA model, which rotates the model plane to maximize separation due to class assignment. Near-complete separation of the 3 classes was observed. Model fit: R2Y(cum) = 93.2%, Q2Y(cum) = 71.0%. (Panel 1C-Inset) The misclassification table for the 3-class OPLS-DA model indicates that 100% of wheat lines (45 of 45 lines) were correctly classified, with low probability (p = 3.10E−17) of random table generation as assessed by Fisher’s Exact Probability. (Panel 1C) To visualize the misclassification rate, the dendrogram depicts hierarchical clustering patterns among major wheat classes using single linkage and size. Two main clusters comprise 1) DW lines and 2) all BW lines, with cluster 2 branching into 2A, comprising SBW lines, and 2B, comprising HBW lines. Node height of cluster 1 from 0 confirms the high degree of chemical distinctness seen within the DW lines evaluated in this study compared to node height of cluster 2.

