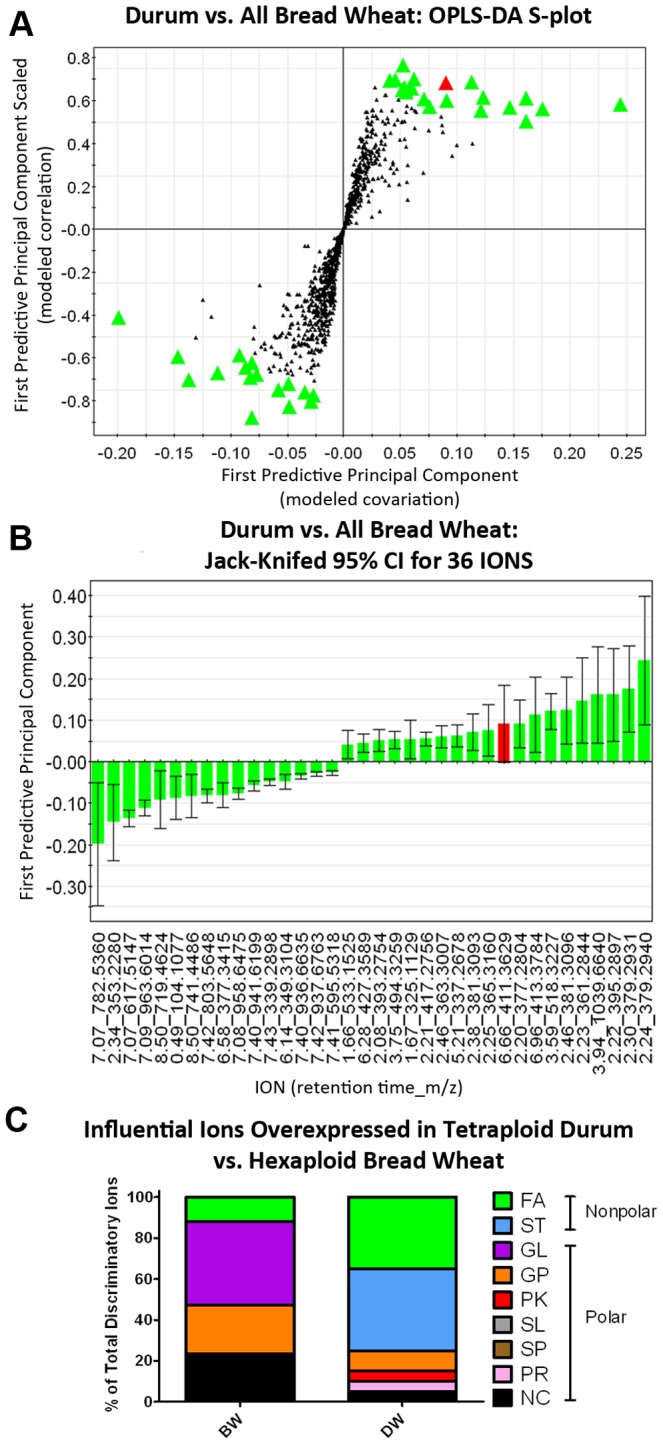
Figure 4. Discriminatory ions of differential polarity determine separation of tetraploid DW from hexaploid BW lines.

Multivariate analysis was extended to identify influential ions responsible for the separation between classes. (Panel 4A) The supervised OPLS-DA model was created to compare all durum lines to all bread wheat lines, and an S-plot was constructed by plotting modeled correlation in the first predictive principal component against modeled correlation from the first predictive component (t1). Upper right and lower left regions of S-plots contain candidate biomarkers with both high reliability and high magnitude; discriminatory ions (n = 36) chosen from these regions are enlarged X3. (Panel 4B) To determine the statistical reliability of the ions chosen in Panel 4A, jack-knifed confidence intervals (JKCI) were created on the magnitude of covariance in the first component for the 36 ions and sorted in ascending order based on expression in durum wheat; ions with JKCI including 0 were excluded from further analysis (indicated by red bars in Panel 4B and red icons in Panel 4A), resulting in n = 35 ions responsible for the separation of durum wheat from bread wheat. (Panel 4C) Of the 31 ions to which tentative compound identities and empirical formulas could be assigned by the METLIN: Metabolite and Tandem MS Database, the tentative identity with the smallest accurate mass error was assigned to 1 of 8 lipid classes according to the Lipid Maps classification system: 1) fatty acyls (FA), 2) glycerolipids (GL), 3) glycerophospholipids (GP), 4) sphingolipids (SP), 5) sterol lipids (ST), 6) prenol lipids (PR), 7) saccharolipids (SL), 8) polyketides (PK), or NC for the 4 ions in which tentative identities could not be matched to the ion m/z. Of the 19 ions overexpressed in durum wheat (DW) compared to bread wheat (BW), 62.5% were tentatively identified as nonpolar lipids, while 74% of the 16 ions overexpressed in BW were tentatively identified as polar lipids, suggesting differences in lipid biosynthetic pathways within the two species.
